Figures & data
Figure 1. The study location on Koome island (Nampijja et al., Citation2015).
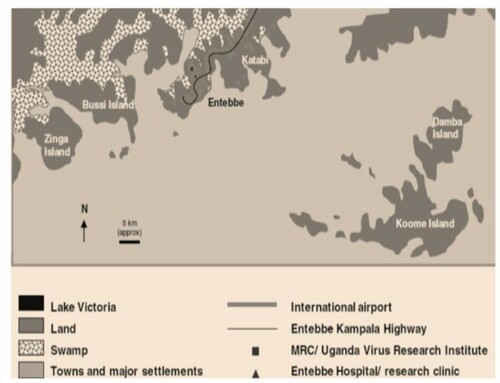
Figure 2. Density and distribution of alcohol and illicit drug use outlets and proximity to young peoples’ homes.
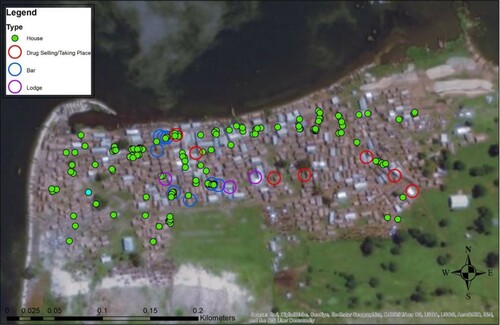
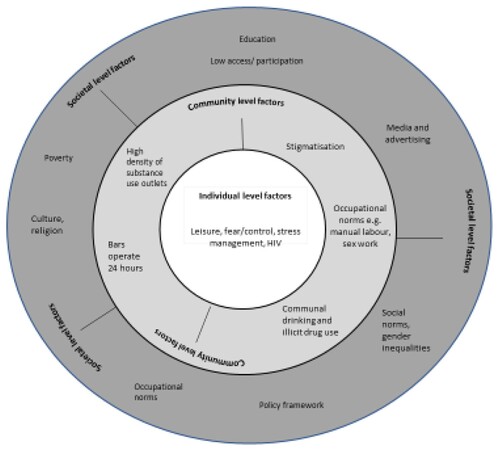
Figure 3. Adapted version of the social ecological framework showing factors driving alcohol misuse and illicit drug use among young people in fishing communities in Uganda.