
Figures & data
Figure 1. (a) Schematic diagram of the synthetic pathway of MS-Bt. The SEM images of (b) Bt, (c) intermediate and (d) MS-Bt. (e) STEM image and corresponding element mapping for MS-Bt.
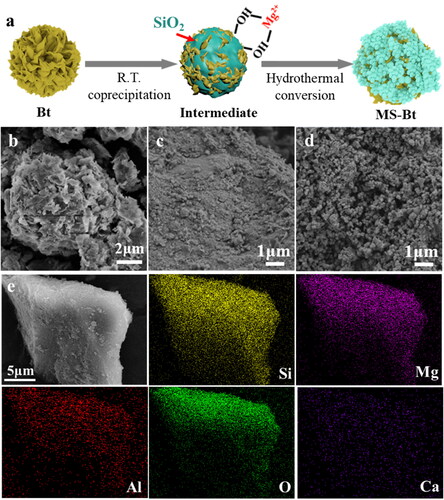
Figure 2. (a) XRD patterns and (b) FT-IR spectra of samples.
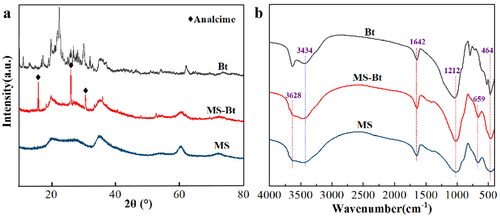
Figure 3. N2 adsorption-desorption isotherms and the size of the corresponding pore size contribution pore capacity of (a,b) MS, (c,d) MS-Bt and (e,f) Bt.
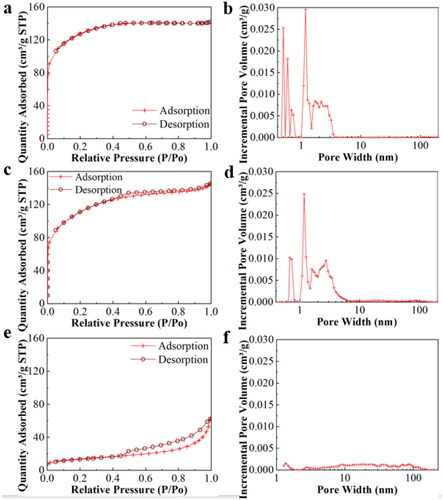
Figure 4. Adsorption properties and XRD patterns of the products prepared by (a,b) different addition ratios of Bt, (c,d) different hydrothermal time and (e,f) different hydrothermal temperature.
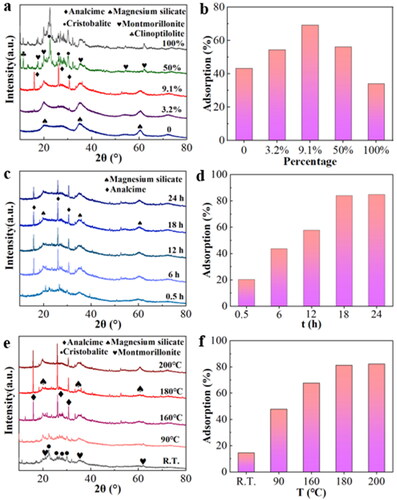
Figure 5. Plot of adsorption amount with (a) adsorption time, (b) solution concentration, (c) solution pH and (d) reaction temperature.
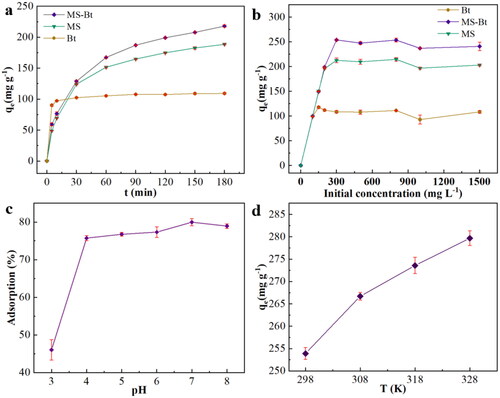
Figure 6. (a) Isotherm model and (b) kinetic model of MS-Bt.
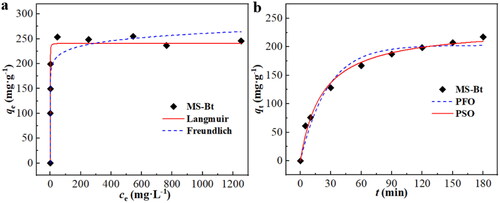
Table 1. Corresponding fitting parameters for the adsorption of MB on the MS-Bt by using Langmuir and Freundlich isotherm models.
Table 2. Kinetic fitting parameters for the adsorption of MB on the MS-Bt by using PFO and PSO models.
Table 3. Adsorption of MB onto sodium Bt: thermodynamic parameters.
Figure 7. (a) XRD patterns and (b) FT-IR spectra of MS-Bt before and after adsorption of MB.
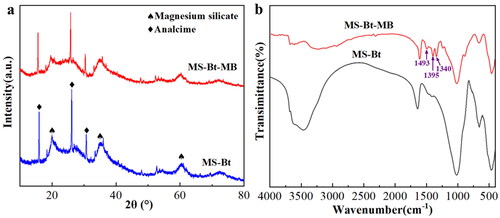
Table 4. Comparison of the removal rates and maximum adsorption for MB on different adsorbents.
Supplemental Material
Download MS Word (4.7 MB)Data availability statement
The data that support the findings of this study are available from the corresponding author.