
Figures & data
Figure 1. Morphological characterisation of DTX@ZIF-8 and DTX@ZIF-8/HA. TEM images DTX@ZIF-8 and DTX@ZIF-8/HA. Scale bar 20 nm.
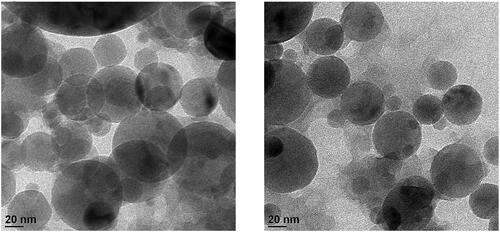
Figure 2. A) XRD patterns of the simulated ZIF-8, pure HA, as-fabricated ZIF-8, DTX@ZIF-8, and DTX@ZIF-8/HA. B) FT-IR spectra of as-prepared ZIF-8, DTX, DTX@ZIF-8, HA, and DTX@ZIF-8/HA.
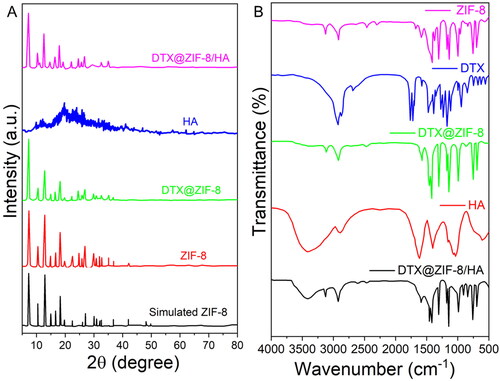
Figure 3. Size distributions measured by DLS of DTX@ZIF-8 and DTX@ZIF-8/HA. DTX@ZIF-8 and DTX@ZIF-8/HA dispersed in pH 7.4 PBS within 12 h and the varies of hydrodynamic diameters of DTX@ZIF-8/HA within 7 days.
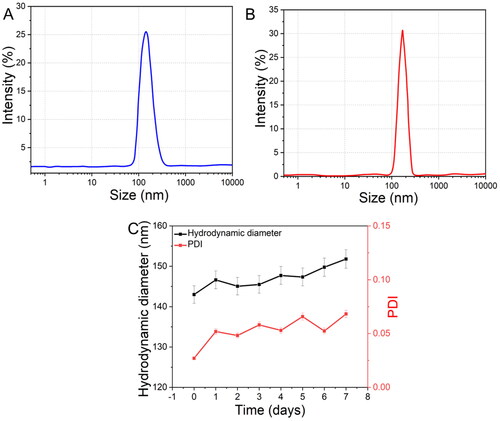
Figure 4. A) UV–vis absorption spectra of ZIF-8, DTX, DTX@ZIF-8 and DTX@ZIF-8/HA. B) N2 absorption-desorption isotherms of ZIF-8 and DTX@ZIF-8. C) A) ZIF-8/HA, DTX, DTX@ZIF-8, and DTX@ZIF-8/HA were dispersed in PBS (pH = 7.4) at different concentrations and did not affect the MTT reading.
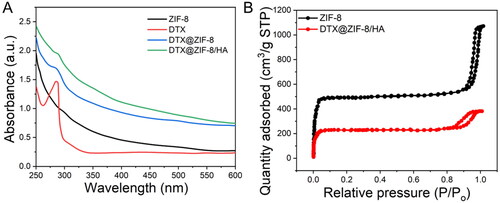
Figure 5. A) The standard curve for DTX solutions was identified at 282 nm by UV–vis. B) Difference in the loading efficacy of DTX@ZIF-8 versus concentrations of DTX. C) The absorbance spectral analysis of the initial DTX solution and the supernatant achieved after the DTX@ZIF-8. D) DTX release profiles from DTX@ZIF-8 in PBS at pH = 5.0 and 7.4.
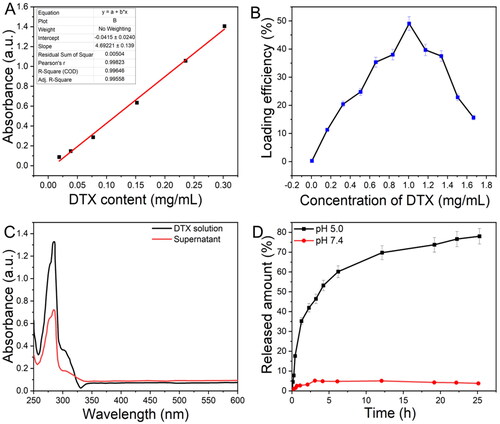
Figure 6. A) In vitro cytotoxicity of K562 cells incubated with samples at different concentrations (0–120 μg/mL of ZIF-8 or 0–90.6 μg/mL of DTX) for 24 h. B) Cell viabilities of HUVECs with incubation of DTX@ZIF-8/HA for 24 h. C) ZIF-8/HA, DTX, DTX@ZIF-8, and DTX@ZIF-8/HA were dispersed in PBS (pH = 7.4) at different concentrations and did not affect the MTT reading.
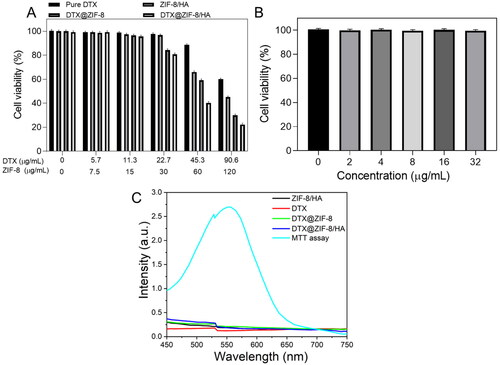
Figure 7. Dual acridine orange/ethidium bromide (AO/EB) staining shows the induction of apoptosis in the K562 cells after being treated with the IC50 concentration of DTX, ZIF-8/HA, DTX@ZIF-8 and DTX@ZIF-8/HA. Scale bar 100 µm.
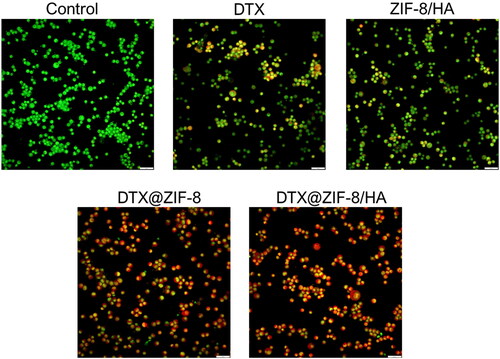
Figure 8. DAPI staining shows the induction of nuclear damage in the K562 cells after being treated with the IC50 concentration of DTX, ZIF-8/HA, DTX@ZIF-8, and DTX@ZIF-8/HA. Scale bar 100 µm.
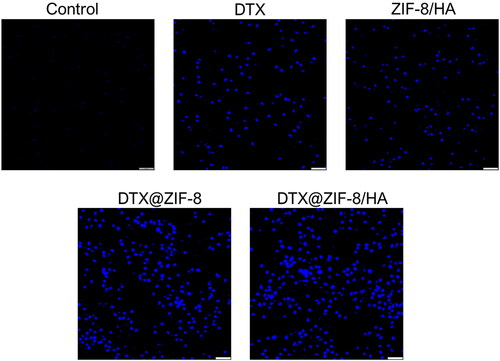
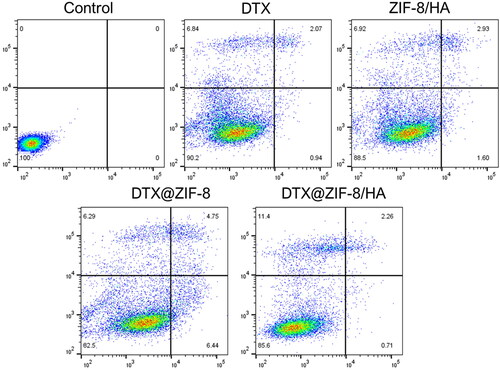
Figure 9. Flow cytometry analysis of K562 cells with the Annexin V-FITC and PI staining after treatment with the IC50 concentration of DTX, ZIF-8/HA, DTX@ZIF-8, and DTX@ZIF-8/HA.
Data availability
All data generated or analysed during this research are included in this published article.