Figures & data
Table 1. Overview of the model’s formal notation.
Figure 1. Solution model.
Table
Table
Figure 2. Iterative Voting procedure.
Table
Table 2. Bus service parameters.
Table 3. Rider parameters. The first row refers to the values of the beta distribution; the second row describes the sampling method for the pick up and drop off locations; the third row shows the number of riders for each experiment.
Table 4. Time frames.
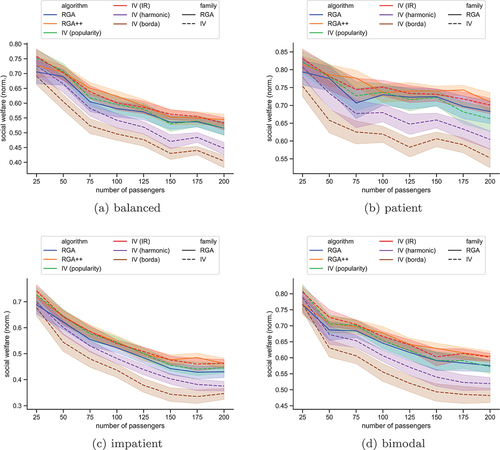
Figure 3. The social welfare, normalized by the number of passengers in the scenario without hotspots, for each algorithm. The plots show bands of confidence intervals.
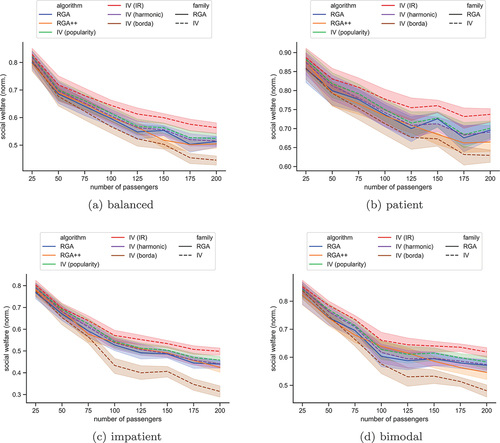
Figure 4. The social welfare, normalized by the number of passengers, in the scenario with hotspots, for each algorithm. The plots show bands of
confidence intervals.

Figure 5. The social welfare, normalized by the number of passengers, in the scenario with 20 hotspots, for each algorithm. The plots show bands of confidence intervals.
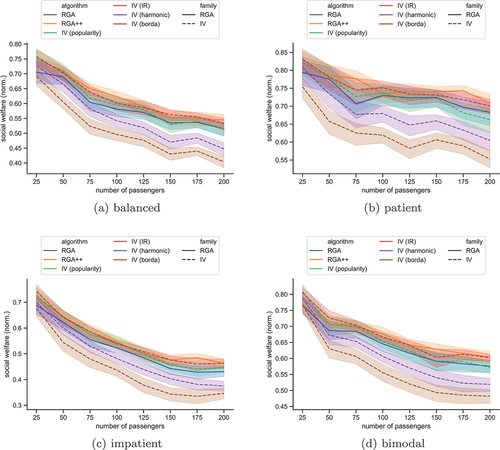
Figure 6. The mean Gini index in the scenario without hotspots, for each algorithm. The plots show bands of confidence intervals.
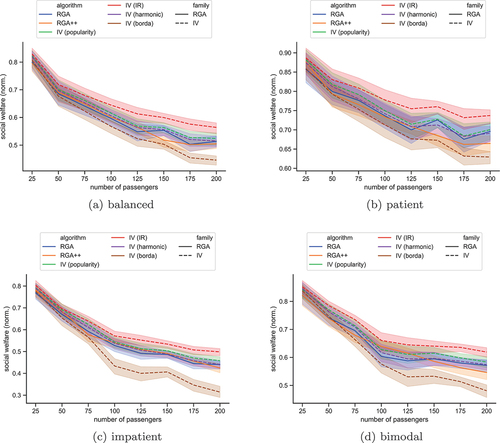
Figure 7. The mean Gini index in the scenario with hotspots, for each algorithm. The plots show bands of
confidence intervals.
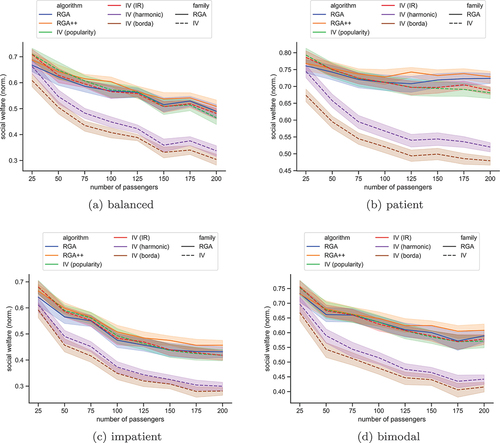
Figure 8. The mean Gini index in the scenario with 20 hotspots for each algorithm. The plots show bands of confidence intervals.