Figures & data
Figure 1. Isometric view of a bench depicting a checkpoint (sphere), accessible blocks (shaded volume), road (arrow) and ramp.
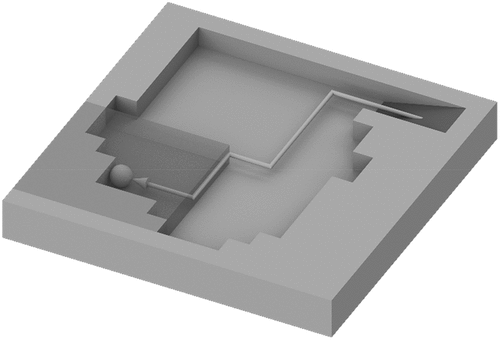
Figure 2. Isometric view of a bench depicting checkpoints (spheres), sub-roads (grid of arrows) and a super-road (curved arrow).
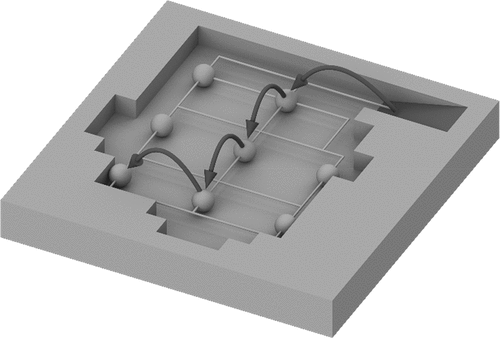
Figure 3. Ramp and road generation tree. The children of each node compose the set of all possible roads that can be constructed by adding a single extension.
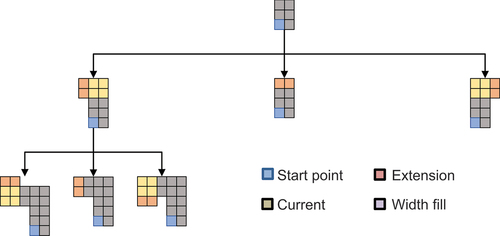
Table 1. Indices.
Table 2. Sets.
Table 3. Constants.
Table 4. Variables.
Figure 4. Bench cross-section containing a ramp, checkpoint (hatched square), mined blocks (white), unmined blocks (shaded) and accessible blocks (hatched circles).
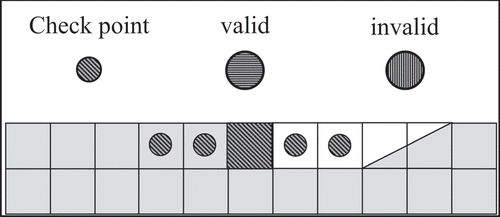
Figure 5. Bench cross-section of accessible and inaccessible ramp placement. Vertically hatched ramp is accessible and horizontally hatched ramp is inaccessible.
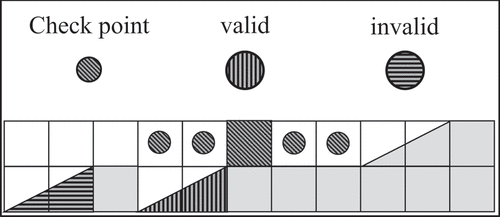
Figure 6. Bench cross-section of valid (vertically hatched) and invalid (horizontally hatched) ramp placements.
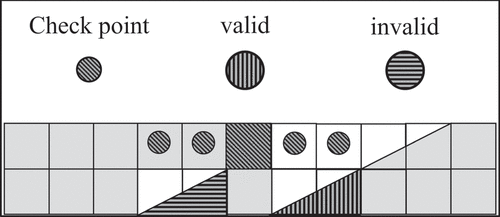
Figure 7. Bench cross-section with intersecting ramp placements.
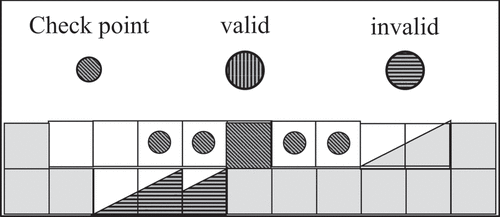
Figure 8. Bench cross-section with valid (solid) and invalid (dashed) super-roads.
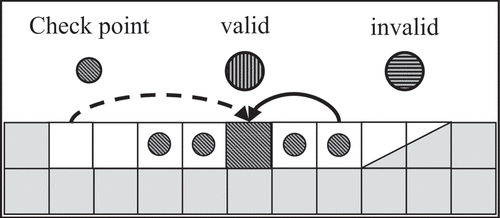
Figure 9. Plan view of bench with a ramp (R), checkpoints (numbered blocks), sub-roads (straight) and super-roads (curved).
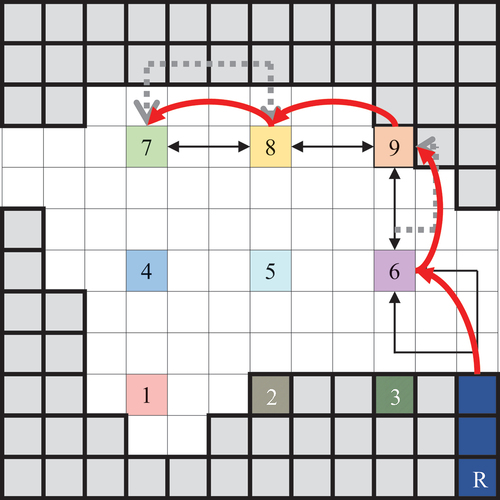
Figure 10. Optimisation loop.
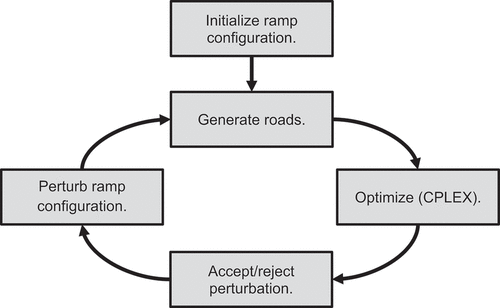
Figure 11. Simulated realisations of gold grades (g/t).
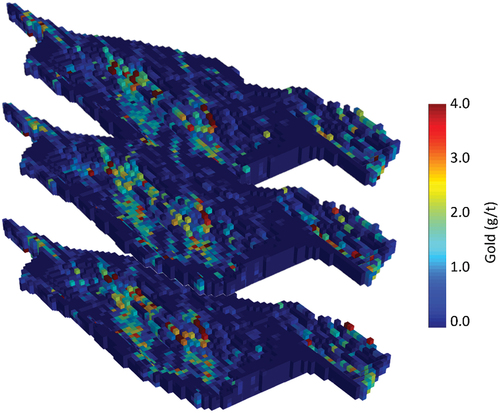
Table 5. Optimisation parameters.
Figure 12. Cross-section at x = 39.
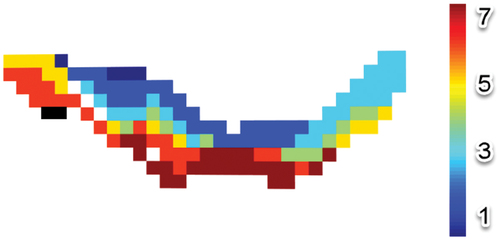
Figure 13. Cross-section at x = 52.

Figure 14. Plan view of the open pit denoting mined blocks (light colors) and ramps (dark blue) in years 2, 4 and 7.
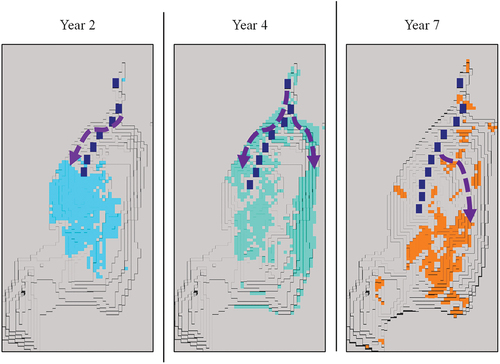
Figure 15. Plan view of the open pit denoting final ramp placement (dark blue).
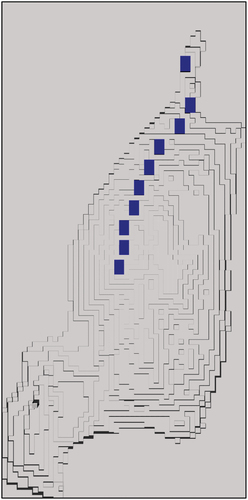
Figure 16. Ramp placement profile and cumulative construction costs of optimised ramp design.
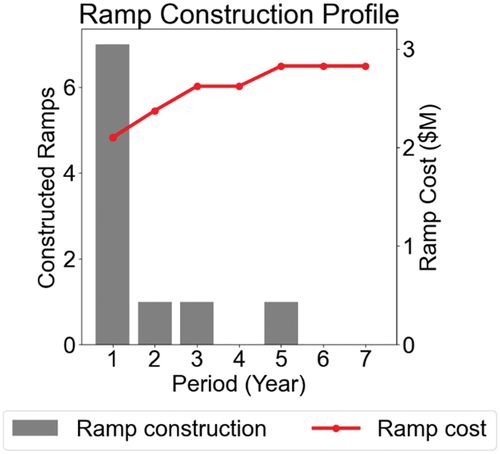
Figure 17. Forecasted cumulative discounted cash flow of production schedule and ramp design.
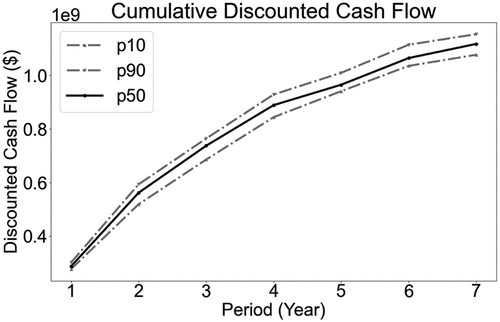
Figure 18. Forecasted gold quantity and grade of life-of-mine production schedule.
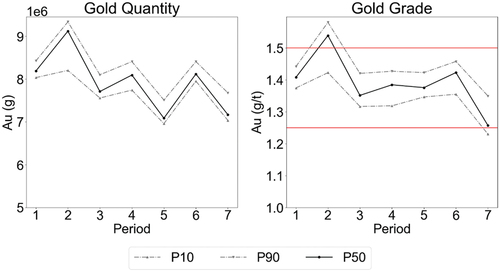
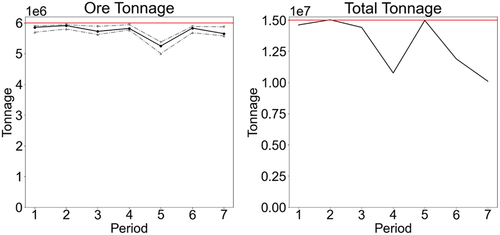
Figure 19. Forecasted ore and total tonnages of production schedule.