
Figures & data
Figure 1. Location and schematic representation of sampling site at Cape Evans, McMurdo Sound, Antarctica. The image on the right shows a typical ice sample melting into manipulated seawater. The ice has been imaged using minimal fluorescence, Fo, with an I-PAM. The circles represent regions of relatively high algal biomass.
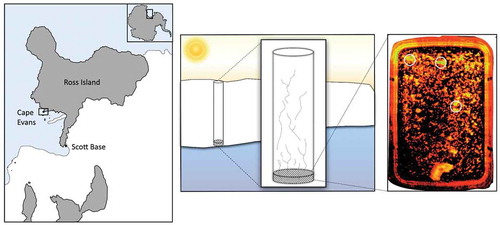
Figure 2. Linear third-order polynomial model of maximum quantum yield (Fv/Fm) for each pH treatment and the control contrasting the difference between start and end-point measurements. The error variance is represented by the dark grey band.
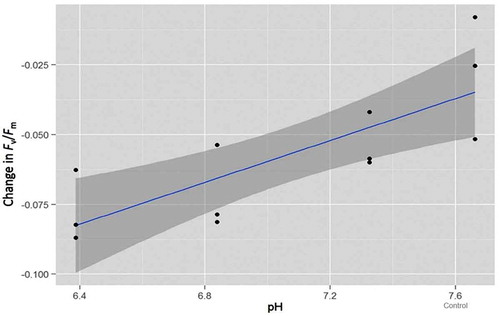
Table 1. Response of sea-ice algae exposed to variable pH during ice-melt. Maximum quantum yield (Fv/Fm) was determined using imaging fluorescence (I-PAM). Each value is the mean with standard error in parentheses, n = 3.
Table 2. Carbonate chemistry of CO2 manipulation experiment utilizing bottom-ice algae at Cape Evan, 2013. The end of experiment data (8-h incubation) illustrates the changes in carbonate chemistry associated with ice-melt. The unit for CT, AT and CO2 is μmol kg−1. The unit for pCO2 is μatm.