Figures & data
Figure 1. Location of the five study streams and associated nutrient uptake experiments.
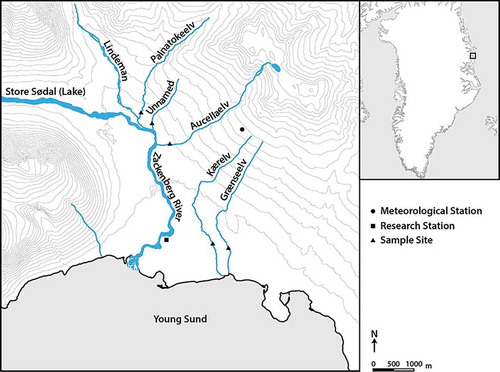
Table 1. F values from one-way ANOVAs for water temperature between streams during the period 11 July to 15 September. Df = (1, 6358).
Table 2. Environmental characteristics and background nutrient concentrations of the five study streams. DO measurements are all from 2015. All other conditions measured on day of sampling. Superscript letters indicate significant differences (p < 0.05) between pairs of streams.
Figure 2. Air temperature (line) and precipitation (bars) during the field campaign.
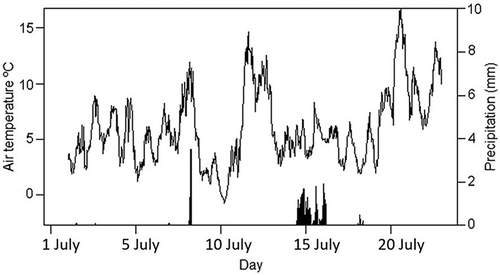
Figure 3. Chl a biomass on stones and gravel in each study stream. Note different Y axis scale. Asterisks highlights significant differences between streams.
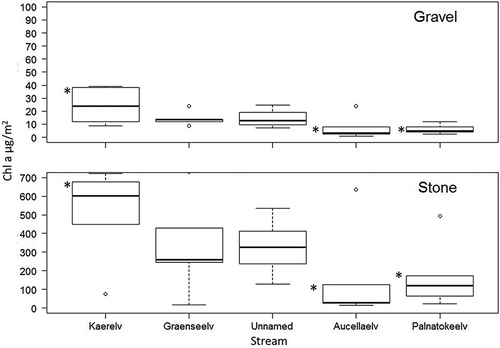
Table 3. Nutrient uptake variables during peak snowmelt period in 2014. Sw in m, Vf in m/h, U in µg m−2 h−1. No detectable uptake is indicated with a dash.
Table 4. Two-way ANOVA results for NDS investigations to determine limiting or used nutrients in each stream. For all sites and substrate types n = 20. F values presented. Significant p values are in boldface.
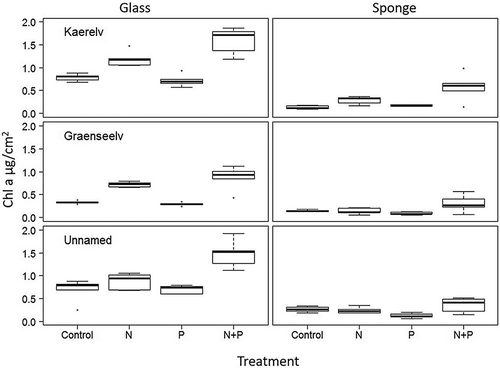
Figure 4. Chl a content in biofilm following different nutrient additions after 16 days.