
Figures & data
Figure 1. Study area of Ningbo city.
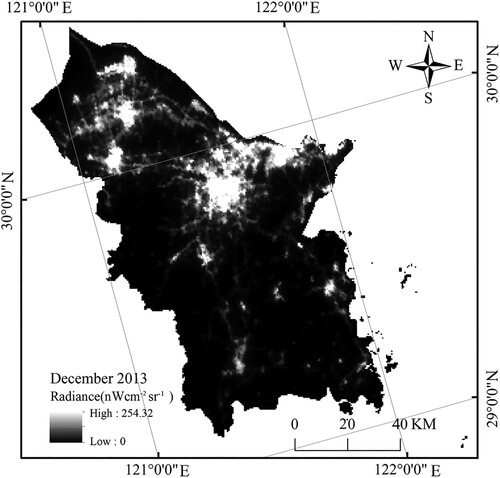
Figure 2. Technical flowchart.
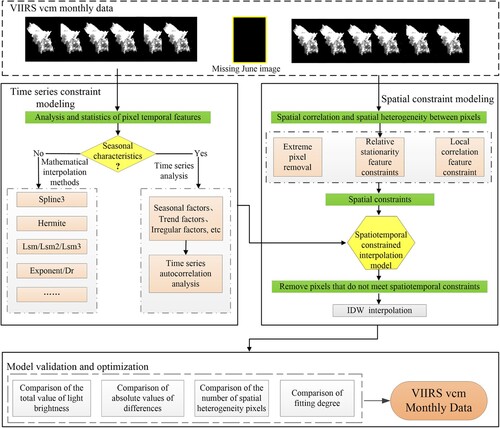
Figure 3. The total value of light brightness in Ningbo city in each month.
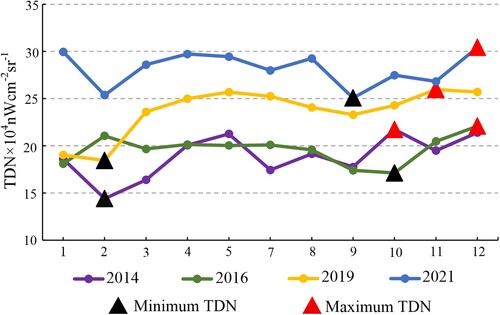
Figure 4. The calculation process figure of dramatic change pixels in June
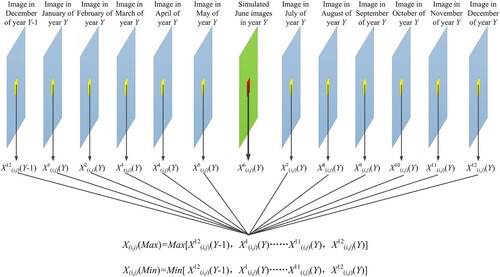
Figure 5. Calculation process for pixels with dramatic changes in monthly differences.
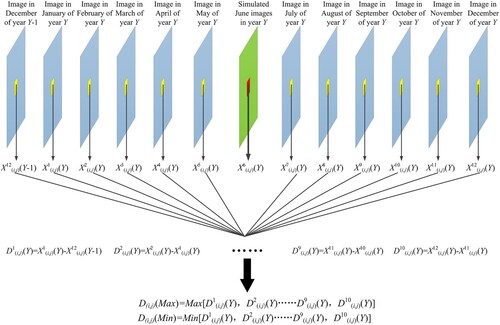
Figure 6. Local Moran’s I of the neighborhood of VIIRS images in July and August 2014.
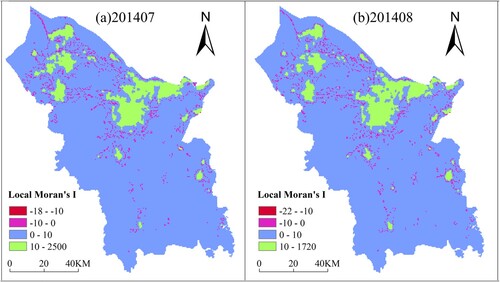
Table 1. The Global Moran’s I for each month of 2014, 2016, 2019 and 2021.
Figure 7. Calculation process for locally autocorrelated abnormal pixels in a neighborhood.
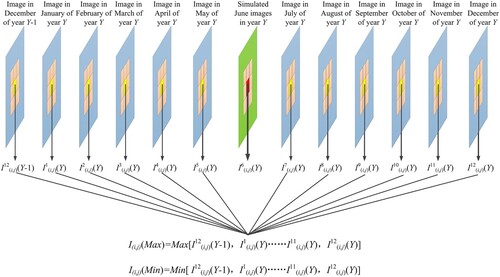
Figure 8. Image simulated by the temporal interpolation methods (TIM). (a)Original image of June 2016 (b)Bezier3 (c)Dr (d)Exponent (e)Hermite3 (f)Spline3 (g)Lsm (h)Lsm2 (i)Lsm3.
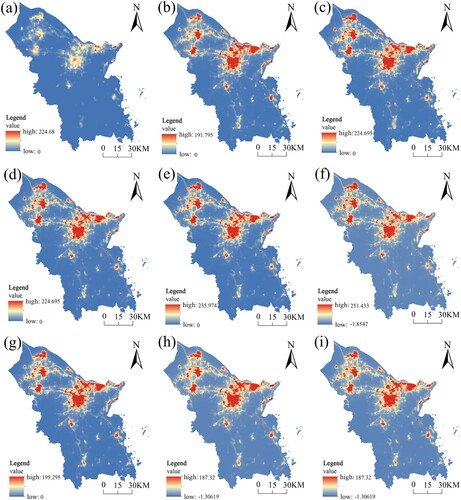
Figure 9. Image simulated by spatiotemporal comprehensive constraint interpolation method (SCIM). (a)Original image of June 2016 (b)Bezier3 (c)Dr (d)Exponent (e)Hermite3 (f)Spline3 (g)Lsm (h)Lsm2 (i)Lsm3.
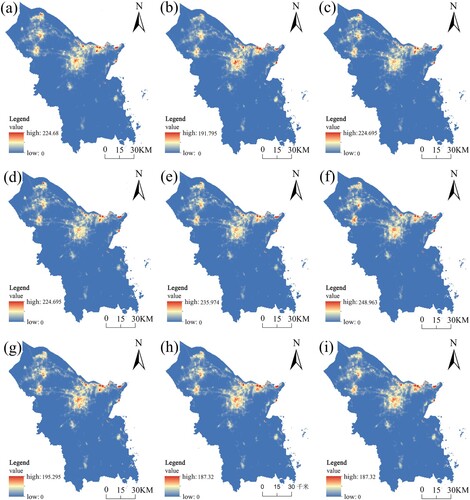
Figure 10. Comparison of the total brightness values of the original image and simulated images using different methods.
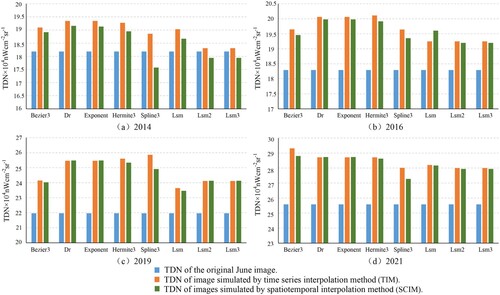
Table 2. Absolute value of the difference between the original image and images simulated with different temporal interpolation methods.
Table 3. Absolute value of the difference between the original image and the images simulated with the spatiotemporal comprehensive constraint interpolation method.
Figure 11. Comparison of the number of spatially heterogeneous pixels between the original image and the images simulated using different methods.
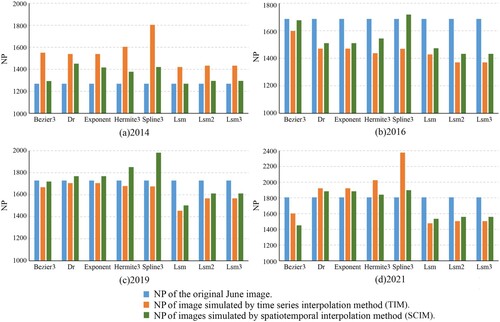
Figure 12. Scatter plots of original image and images pixel light brightness simulated by the temporal interpolation methods (TIM) in 2014. (a)Bezier3 (b)Dr (c)Exponent (d)Hermite3 (e)Spline3 (f)Lsm (g)Lsm2 (h)Lsm3.
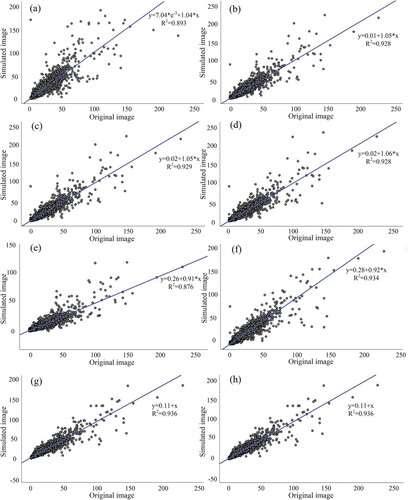
Figure 13. Scatter plots of original image and images pixel light brightness simulated by the spatiotemporal comprehensive constraint interpolation method (SCIM) in 2014. (a)Bezier3 (b)Dr (c)Exponent (d)Hermite3 (e)Spline3 (f)Lsm (g)Lsm2 (h)Lsm3.
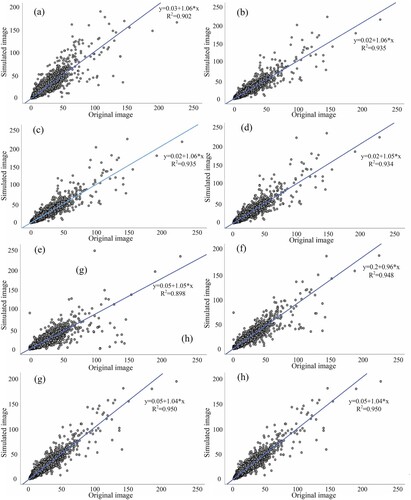
Table 4. The fitting degree (R2) between the simulated image and the original image.
Data availability statement
The data that support the findings of this study are openly available at https://eogdata.mines.edu/products/vnl/.