
Figures & data
Figure 1. Implementation flowchart for the accelerated pixel dichotomy method coupled with the linear kernel-driven model (PDKDM-A).
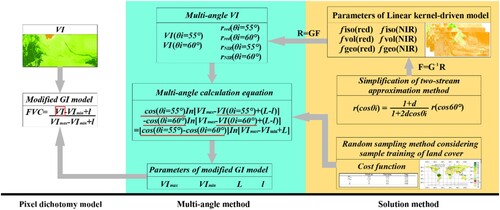
Table 1. Polynomial coefficients in the linear kernel-driven model.
Table 2. Value range of VImin, VImax, l, and L based on prior knowledge.
Figure 2. Synthesized Sentinel-2 images composed of RGB band on July 10th–20th, 2021. Here the field-measured plots are represented by green points, while the red points indicate the selected plots for comparing the FVC calculated by PDKDM-A with FVC products (PROBA-V). The upper and lower panels display sub-images of the areas chosen for spatial comparison between the FVC calculated by PDKDM-A and the FVC products. The land cover symbols are the same as in . Please be aware that, because of the size, several nearby points are represented by a solitary green point.
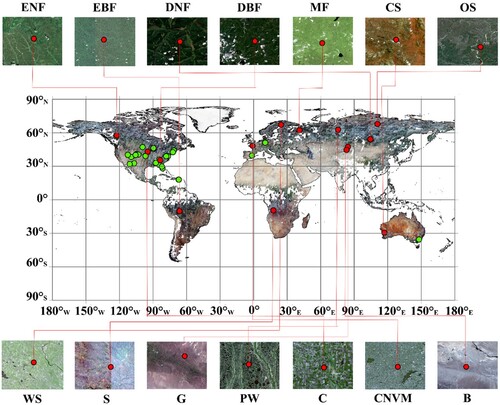
Figure 3. Global land cover data in 2019.
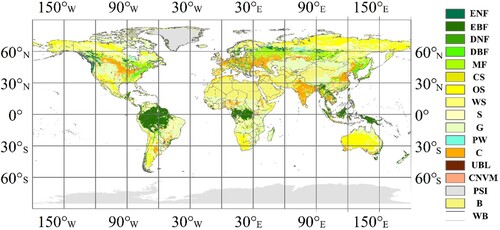
Table 3. Coordinate points for the validation of time series between the FVC calculated by PDKDM-A and field-measured data.
Table 4. Coordinate points for time series validation between the FVC calculated by PDKDM-A and PROBA-V.
Figure 4. Comparison between the FVC calculated by PDKDM-A and field-measured FVC for different land covers. The types of forests include: (a) Evergreen needleleaf forests; (b) evergreen broadleaf forests; (c) deciduous broadleaf forests; (d) mixed forests; (e) closed shrublands; (f) open shrublands; (g) grasslands; (h) croplands; and (i) cropland/natural vegetation mosaics.
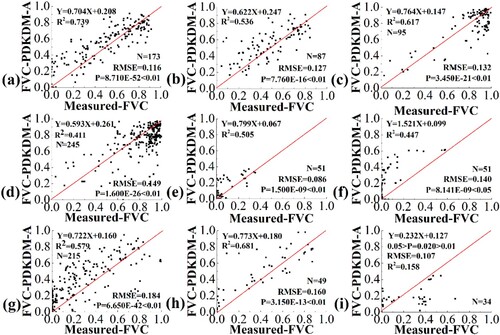
Figure 5. Seasonal changes were compared between the FVC calculated by PDKDM-A and the field-measured FVC for various land covers. The types of forests include: (a) Evergreen needleleaf forests; (b) evergreen broadleaf forests; (c) deciduous broadleaf forests; (d) mixed forests; (e) closed shrublands; (f) open shrublands; (g) grasslands; (h) croplands; and (i) cropland/natural vegetation mosaics. shows the results across a two-year period.
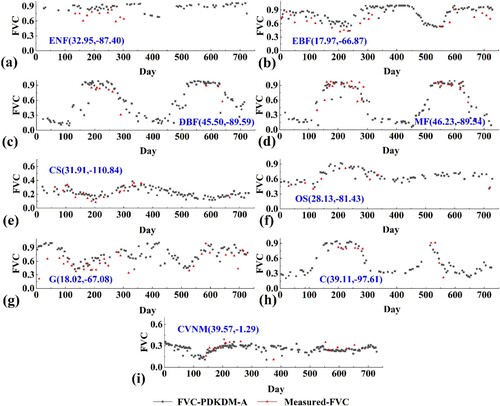
Figure 6. Comparing the FVC estimated using PDKDM-A with the FVC products (PROBA-V) for the evergreen forests. (a), (e), (i) and (m) are the images of needleleaf forests composed of RGB band. (b), (f), (j) and (n) are FSR FVC estimated by PDKDM-A from Sentinel-2 images. (c), (g), (k) and (o) are up-scaling images for FSR FVC estimated by PDKDM-A. (d), (h), (l), (p) are FVC products (PROBA-V). (a-h) Evergreen needleleaf forests and (i-p) evergreen broadleaf forests.
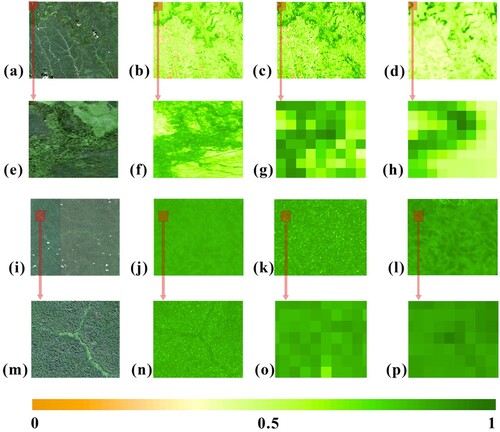
Figure 7. Comparing the FVC estimated using PDKDM-A with the FVC products (PROBA-V) for the deciduous forests. (a), (e), (i), (m), (q) and (u) are the images of deciduous forests and mixed forests composed of RGB band. (b), (f), (j), (n), (r) and (v) are FSR FVC estimated by PDKDM-A from Sentinel-2 images. (c), (g), (k), (o), (s) and (x) are up-scaling images for FSR FVC estimated by PDKDM-A. (d), (h), (l), (p), (t) and (x) are FVC products (PROBA-V). (a-h) Deciduous needleleaf forests, (i-p) deciduous broadleaf forests, and (q-x) mixed forests.
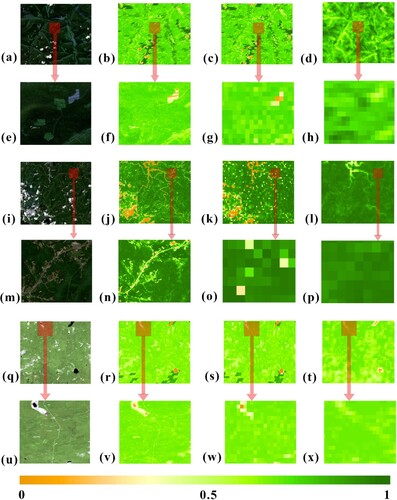
Figure 8. Comparing the FVC estimated using PDKDM-A with the FVC products (PROBA-V) for the shrublands. (a), (e), (i) and (m) are the images of shrublands composed of RGB band. (b), (f), (j) and (n) are FSR FVC estimated by PDKDM-A from Sentinel-2 images. (c), (g), (k) and (o) are up-scaling images for FSR FVC estimated by PDKDM-A. (d), (h), (l), (p) is FVC products (PROBA-V). (a-h) closed shrublands and (i-p) open shrublands.
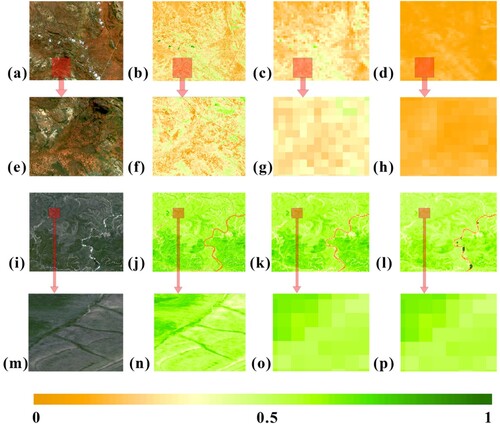
Figure 9. Comparing the FVC estimated using PDKDM-A with the FVC products (PROBA-V) for the savannas and the grasslands. (a), (e), (i), (m), (q) and (u) are the images of savannas and grasslands composed of RGB band. (b), (f), (j), (n), (r) and (v) are FSR FVC estimated by PDKDM-A from Sentinel-2 images. (c), (g), (k), (o), (s) and (x) are up-scaling images for FSR FVC estimated by PDKDM-A. (d), (h), (l), (p), (t) and (x) are FVC products (PROBA-V). (a-h) Woody savannas, (i-p) savannas, and (s-t) grasslands.
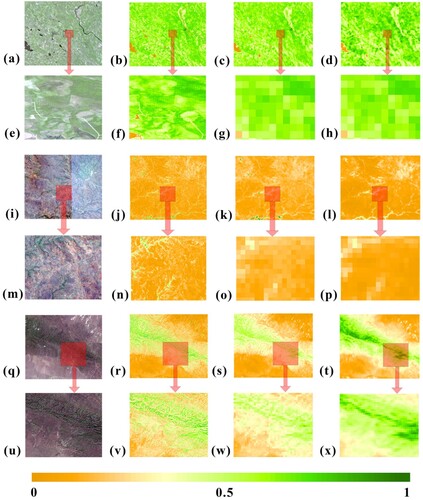
Figure 10. Comparing the FVC estimated using PDKDM-A with the FVC products (PROBA-V) for the permanent wetlands.
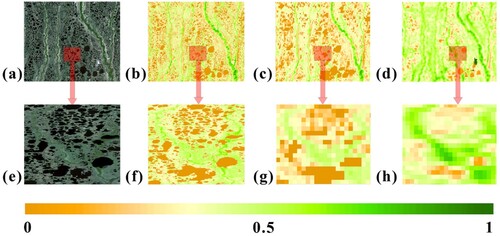
Figure 11. Comparing the FVC estimated using PDKDM-A with the FVC products (PROBA-V) for the croplands. (a), (e), (i), and (m) are the images of croplands composed of RGB band. (b), (f), (j), and (n) are FSR FVC estimated by PDKDM-A from Sentinel-2 images. (c), (g), (k), and (o) are up-scaling images for FSR FVC estimated by PDKDM-A. (d), (h), (l), and (p) are FVC products (PROBA-V). (a-h) croplands and (i-p) cropland/natural vegetation mosaics.
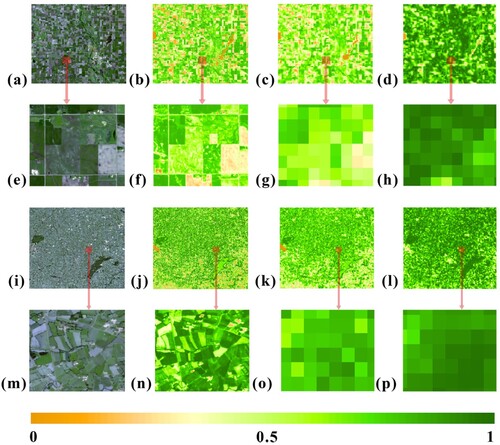
Figure 12. Comparing the FVC estimated using PDKDM-A with the FVC products (PROBA-V) for the barren areas.
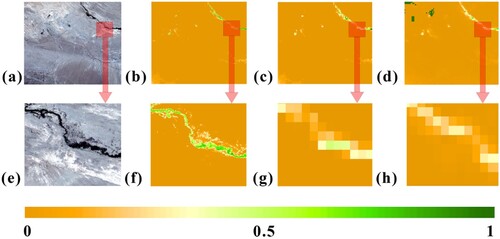
Figure 13. Density plots comparing the up-scaling images for FSR FVC estimated by PDKDM-A and FVC products (PROBA-V). Types of forests include: (a) Evergreen needleleaf forests; (b) evergreen broadleaf forests; (c) deciduous needleleaf forests; (d) deciduous broadleaf forests; (e) mixed forests; (f) closed shrublands; (g) open shrublands; (h) woody savannas; (i) savannas; (j) grasslands; (k) permanent wetlands; (l) croplands; (m) cropland/natural vegetation mosaics; and (n) barren areas.
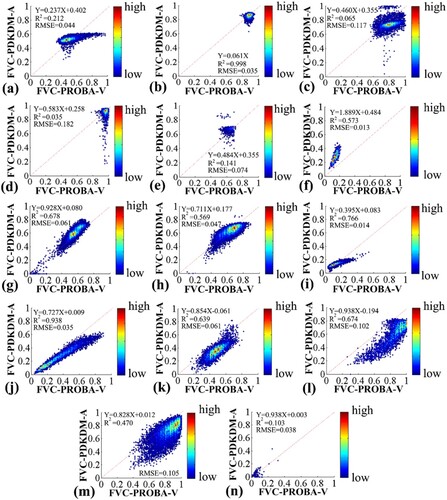
Figure 14. Comparison between the FVC calculated by PDKDM-A and FVC products (PROBA-V) in terms of seasonal changes. Types of forests include: (a) Evergreen needleleaf forests; (b) evergreen broadleaf forests; (c) deciduous needleleaf forests; (d) deciduous broadleaf forests; (e) mixed forests; (f) closed shrublands; (g) open shrublands; (h) woody savannas; (i) savannas; (j) grasslands; (k) permanent wetlands; (l) croplands; (m) cropland/natural vegetation mosaics; and (n) barren areas.
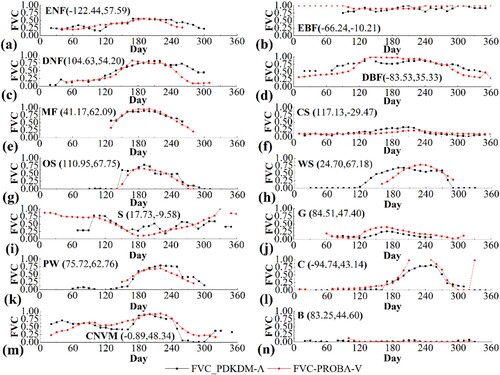
Figure 15. Comparison between FVC estimated by PDKDM and FVC estimated by PDKDM-A. (a) FVC in the croplands estimated by PDKDM, (b) Croplands FVC estimated by PDKDM-A, (c) FVC in the desert estimated by PDKDM, (d) FVC in the desert estimated by PDKDM-A, (e) FVC in the croplands estimated by PROSAIL + BPNNs in the Sentinel-2 ToolBox, (f) Croplands FVC estimated by PROSAIL + BPNNs in the Sentinel-2 ToolBox, (g) density plots comparing the FVC in the croplands calculated by PDKDM and PDKDM-A, (h) density plots comparing the FVC in the desert calculated by PROSAIL + PDKDM and PDKDM-A. (i) density plots comparing the FVC in the croplands calculated by PROSAIL + BPNNs and PDKDM-A, (j) density plots comparing the FVC in the desert calculated by BPNNs and PDKDM-A.
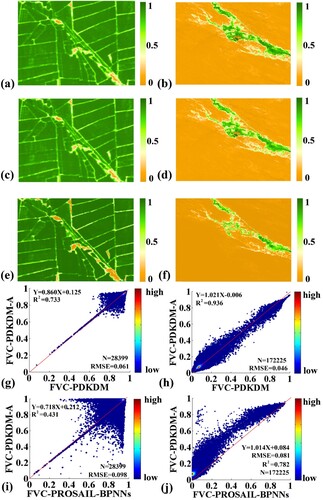
Figure 16. Global FVC with a spatial resolution of 10 m and a time resolution of 1 month in the first half of 2019. The months of the year are: (a) January; (b) February; (c) March; (d) April; (e) May; (f) June.
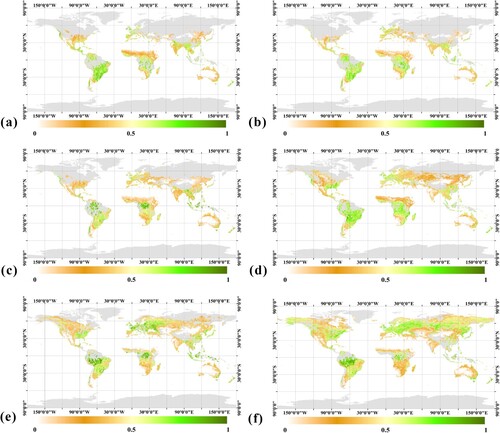
Figure 17. Global FVC with a spatial resolution of 10 m and a time resolution of 1 month in the second half of 2019. The months of the year are: (a) July; (b) August; (c) September; (d) October; (e) November; and (f) December.
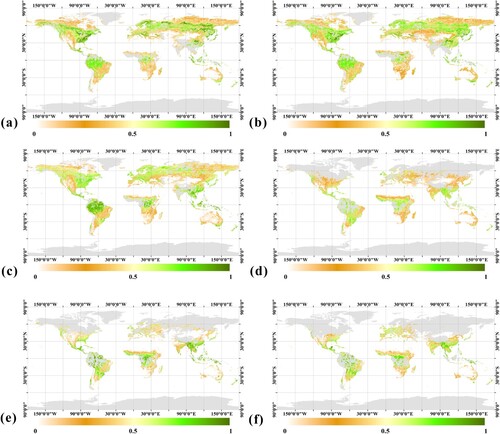
Figure 18. Proportion of valid pixel for FVC and FVC in the different levels for valid pixels. (a) Proportion of valid pixels for the estimation of FVC in land surface area, (b) FVC in the different levels for the valid pixels of the estimation of FVC in land surface area.
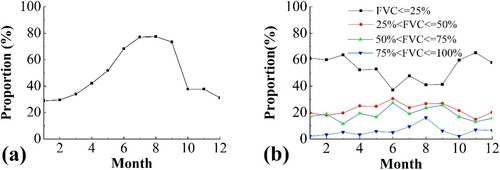
Table 5. Computational time statistics of PDKDM-A for global FVC with a spatial resolution of 10 m and a time resolution of 1 month.
Data availability statement
The data supporting the findings of this study are estimated from the Google Earth Engine. Restrictions apply to the availability of these data, which were used under the license for this study. Data are available from the author, [email protected].