
Figures & data
Figure 1. The climate types (a) and topography (b) of Chile.
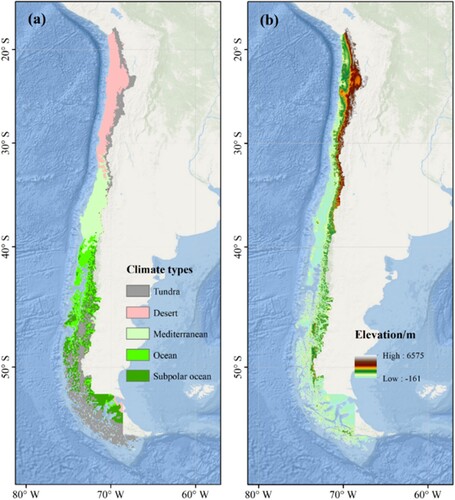
Figure 2. Main reference and supporting information for each cycle of interpretation training and test.
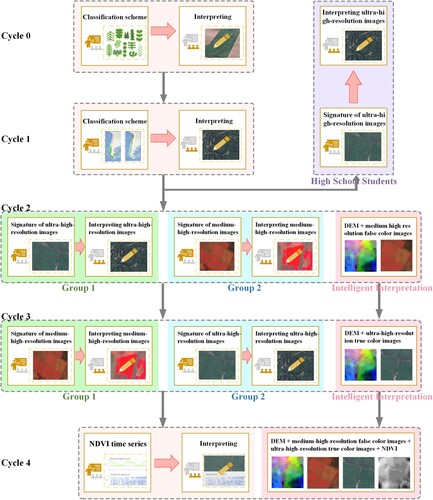
Table 1. Land cover classification scheme.
Figure 3. Examples of ultra-high and medium-high resolution (true and false color composite) images and spectral curves. (a–c): The samples are of croplands, specifically rice fields (label = 110), woody orchards (label = 141), and vine-like orchards (label = 142) respectively. (d–f): The samples are of forests, including broadleaf native forest (label = 210), old needle-leaf plantation (label = 251), and mixed native forest (label = 230) respectively. (g–h): The samples consist of annual pasture (label = 311) and other grassland (label = 320). (i–j): The samples of shrublands (label = 410). (k): The reservoir sample (label = 620). (l): The sample of impervious surface (label = 800). (m–n): The samples are of barren lands, specifically dry salt flat (label = 910) and gravel (label = 932). (o–u): False color composite images and the curve at the bottom of each image represents the reflection spectrum curve of the central blue point. They are representative examples of croplands, forests, grasslands, shrublands, water bodies, impervious surfaces, and barren lands.
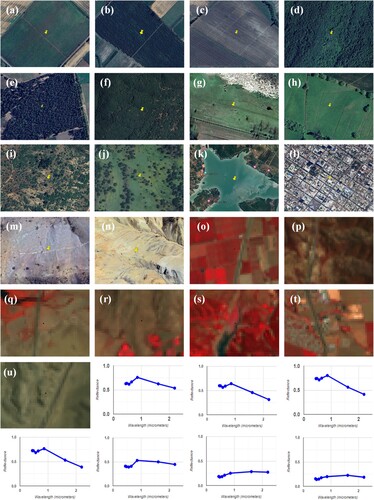
Figure 4. Examples illustrate the differences in NDVI time series between various vegetation types, such as croplands, forests, grasslands, and shrublands. (a–d): The samples of croplands, forests, grasslands, and shrublands.
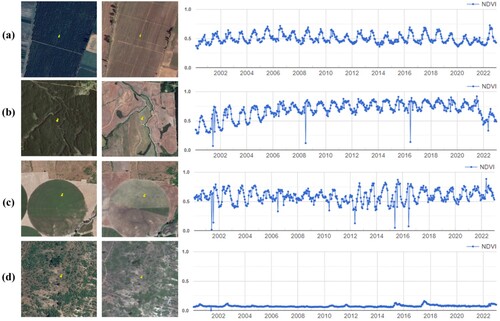
Figure 5. Accuracy of different groups before and after training.
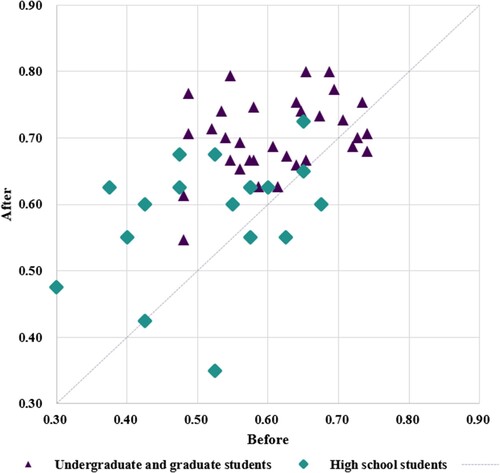
Figure 6. Changes in the accuracy of samples under third-level and first-level classification schemes.
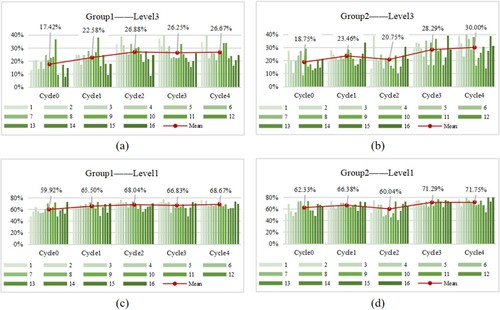
Figure 7. AI interpretation accuracy and its training time consumption.
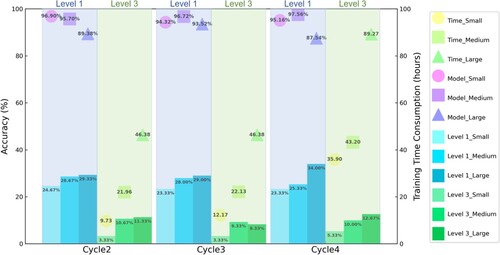
Table 2. Sensitivity to reference material.
Figure 8. Sensitivity of several vegetation types to reference material.
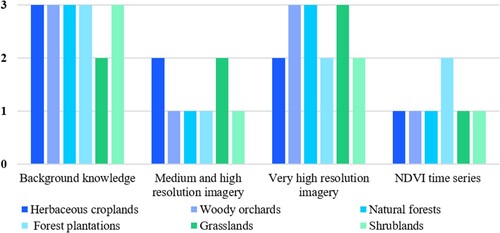
Figure 9. Accuracy of the most consistent land cover types.
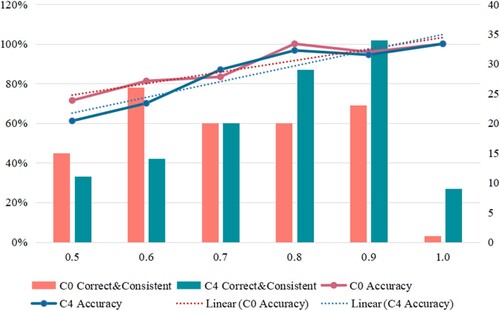
Figure 10. Examples of confusing samples. (a–d): The samples include croplands (herbaceous cropland), grasslands (annual pasture), forests (broadleaf plantation), and shrublands (shrubland plantation). (e–f): Water bodies in different seasons or years.
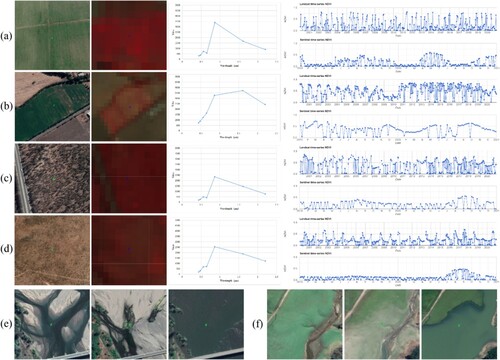
Table 3. Cycle0: The confusion matrix of the most consistent and true land cover types.
Table 4. Cycle 4: The confusion matrix of the most consistent and true land cover types.
Data availability statement
Data sharing is not applicable to this article as no new data were created or analyzed in this study.