Figures & data
Figure 1. North Atlantic Ocean domain used in the twin data assimilation experiment. Bathymetry shown in colour contours; Faraday Fracture Zone (the area of interest) shown by the black box in the centre of the domain.
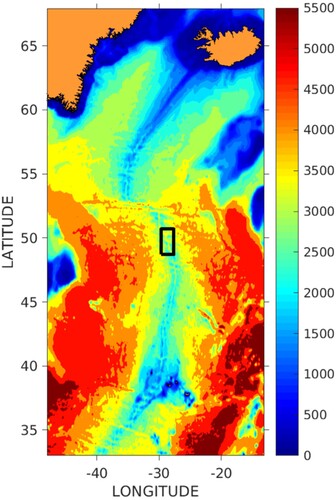
Figure 2. Non-assimilative (free run) model average profile root-mean square error compared to the NR for July (top panels), August (bottom panels), temperature (left panels), and salinity (right panels).
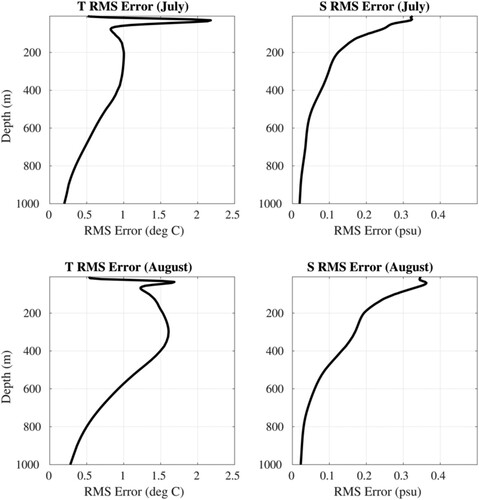
Figure 3. Same as , but for the wintertime float deployment experiment (1 December 2019 through 29 February 2020).
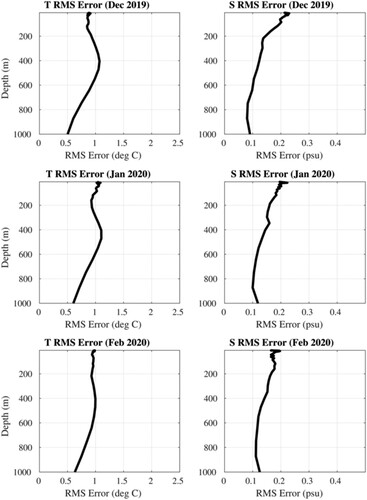
Figure 4. Profiling float deployments on 25 June 2019 (summertime) and 1 December 2019 (wintertime) sampling data from the NR for 81 floats (far left panel), 156 floats (inner left panel), 240 floats (inner right panel), and 324 floats (far right panel).
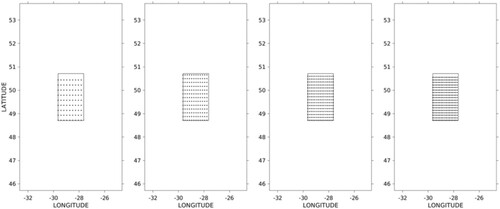
Figure 5. Profiling float trajectories (top panels) and final float positions (bottom panels) for the summertime float deployment (25 June through 1 September 2019) using 81 floats (far left panels), 156 floats (inner left panels), 240 floats (inner right panels), and 324 floats (far right panels).
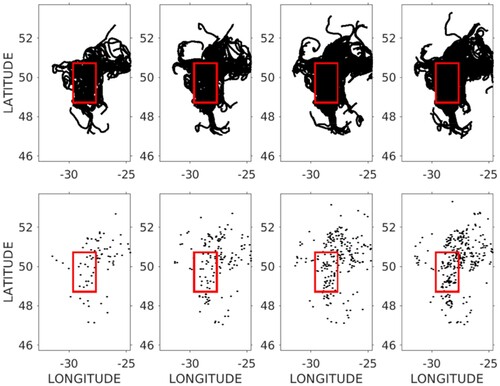
Figure 6. Same as , but for the wintertime deployment (1 December 2019 through 29 February 2020).
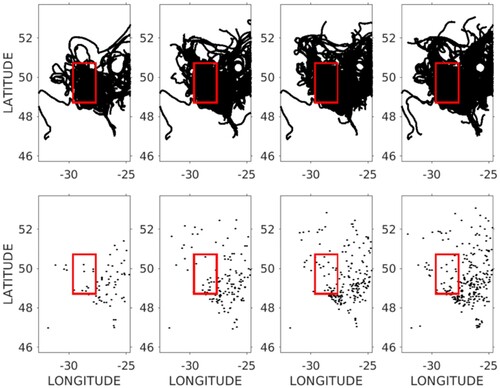
Figure 7. Total profiling float count within the AOI from each of the summertime float deployment experiments (25 June through 1 September 2019).
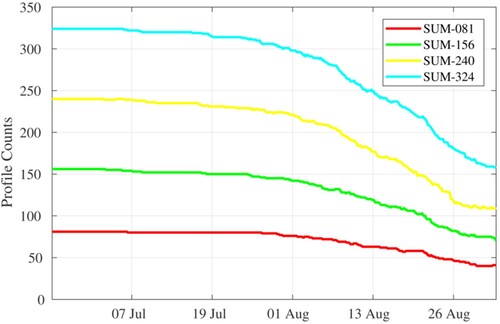
Figure 8. Same as , but for each of the wintertime float deployment experiments (1 December 2019 through 29 February 2020).
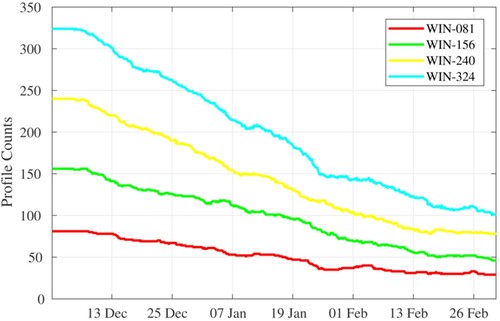
Figure 9. Average temperature profile within the AOI during the (a) summertime deployment and (b) wintertime deployment. Approximate location for the average MLD and TD is indicated.
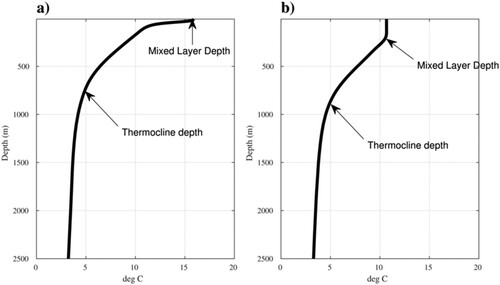
Figure 10. 24-hour model forecast profile RMSE averaged over each month (as compared to the NR within the AOI) between the Base Run (solid black line), and each of the summertime float deployment experiments (colour lines) for July (top panels) and August (bottom panels) in temperature (left panels) and salinity (right panels).
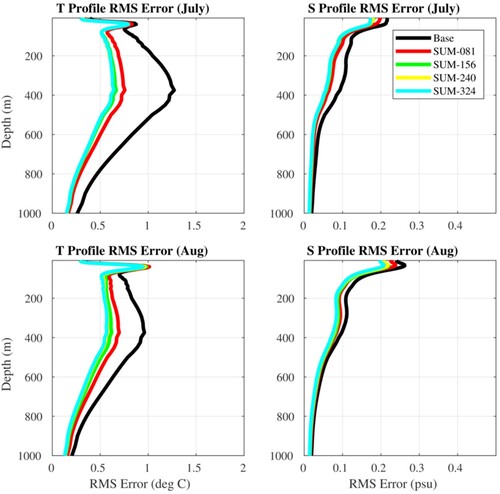
Figure 11. Mixed Layer Depth (MLD) RMSE (as compared to the NR within the AOI) from 25 June through 1 September 2019 for the Base Run (solid black line), and each of the summertime float deployment experiments (colour lines).
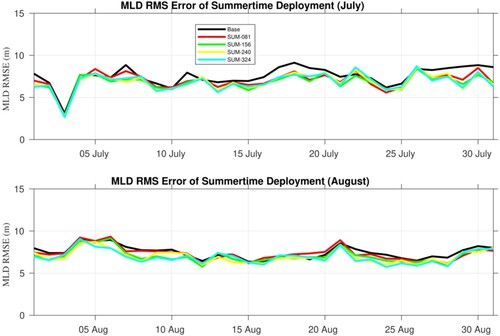
Figure 12. Mixed Layer Depth (MLD) skill score metric (relative to the Base Run) from 25 June through 1 September 2019 for each of the summertime float deployment experiments (colour lines).
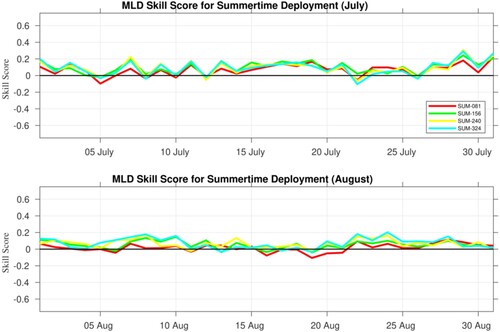
Figure 13. SST super-observation locations on 1 July 2019 (within the AOI).
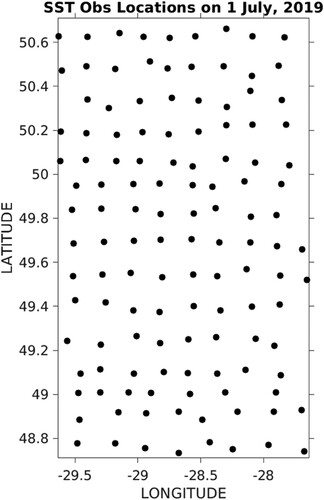
Figure 14. NCODA-3DVAR horizontal background error correlation scales within the AOI (left panel in kilometres) and the vertical background error correlation scale at a grid point near the centre of the AOI.
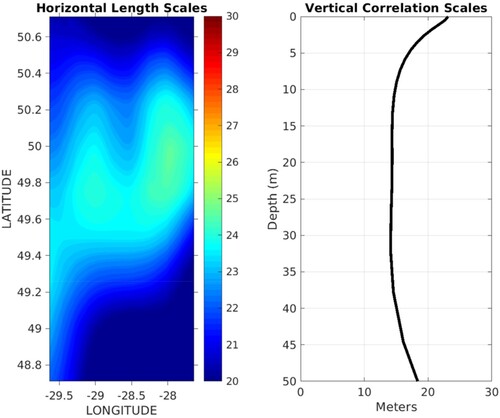
Figure 15. RMSE (top panel) and bias (bottom panel) in the ocean model SST for the Base Run (black line) and the summertime float deployment experiment with 324 floats (red line) as compared to the NR within the AOI from 25 June through 1 September 2019.
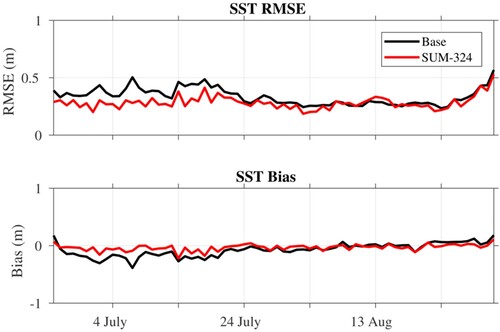
Figure 16. Thermocline depth (TD) RMSE (as compared to the NR within the AOI) from 25 June through 1 September 2019 for the Base Run (solid black line), and each of the summertime float deployment experiments (colour lines).
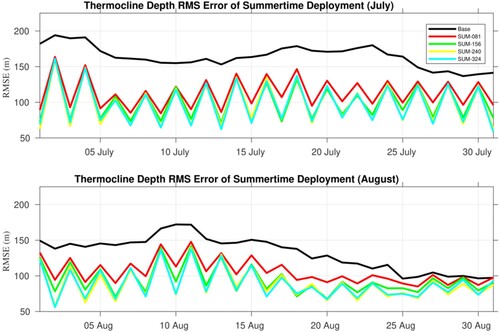
Figure 17. Thermocline (TD) skill score metric (relative to the Base Run) 25 June through 1 September 2019 for each of the summertime float deployment experiments (colour lines).
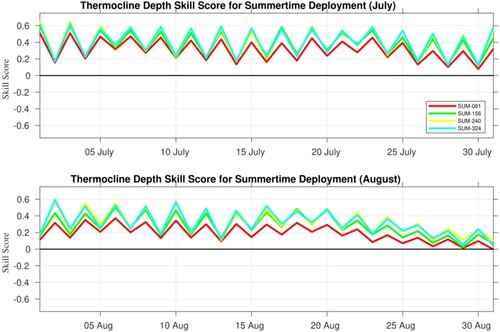
Figure 18. 24-hour model forecast profile RMSE averaged over each month (as compared to the NR within the AOI) between the Base Run (solid black line), and each of the wintertime float deployment experiments (colour lines; 1 December 2019 through 29 February 2020). Top panels show December 2019; middle panels show January 2020; bottom panels show February 2020.
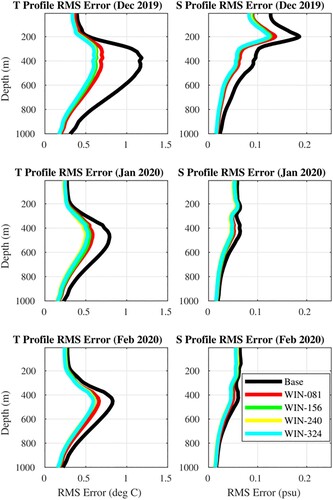
Figure 19. Mixed Layer Depth (MLD) RMSE (as compared to the NR within the AOI) from 1 December 2019 through 29 February 2020 for the Base Run (solid black line) and each of the wintertime float deployment experiments (colour lines).
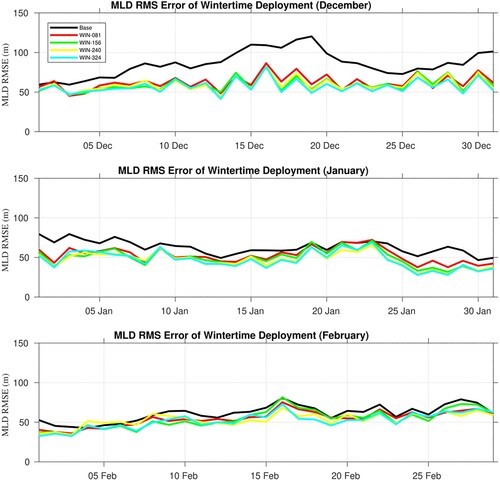
Figure 20. Mixed Layer Depth (MLD) skill score metric (relative to the Base Run) from 1 December 2019 through 29 February 2020 for each of the wintertime float deployment experiments (colour lines).
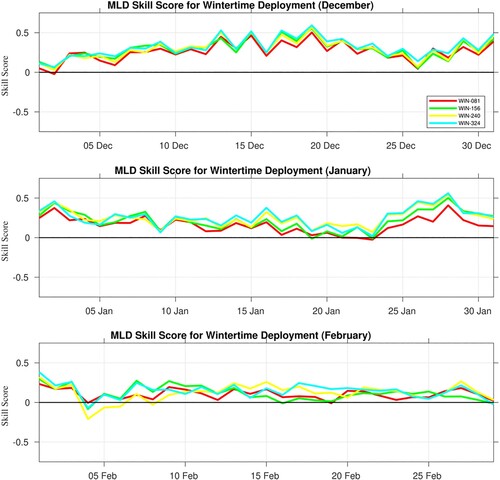
Figure 21. Thermocline depth (TD) RMSE (as compared to the NR within the AOI) from 1 December 2019 through 29 February 2020 for the Base Run (solid black line) and each of the wintertime float deployment experiments (colour lines).
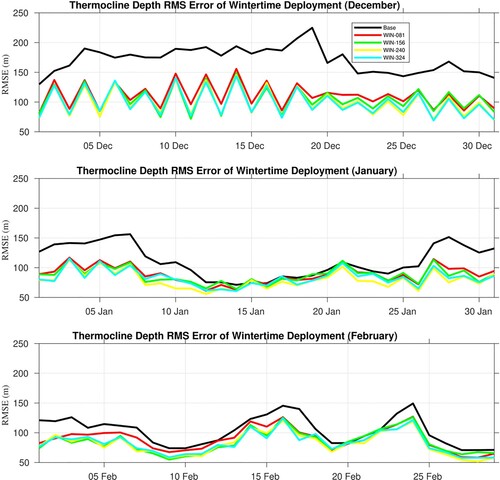
Figure 22. Thermocline depth (TD) skill score metric (relative to the Base Run) from 1 December 2019 through 29 February 2020 for each of the wintertime float deployment experiments (colour lines).
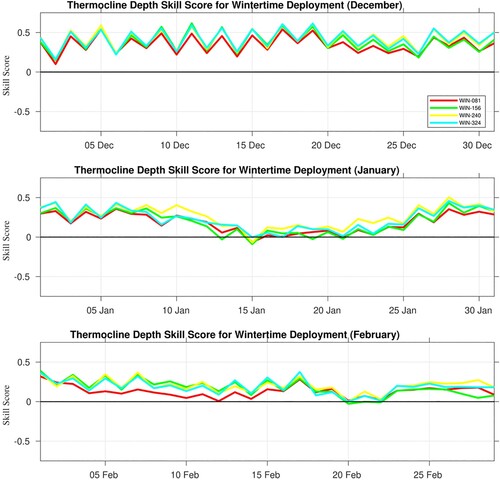
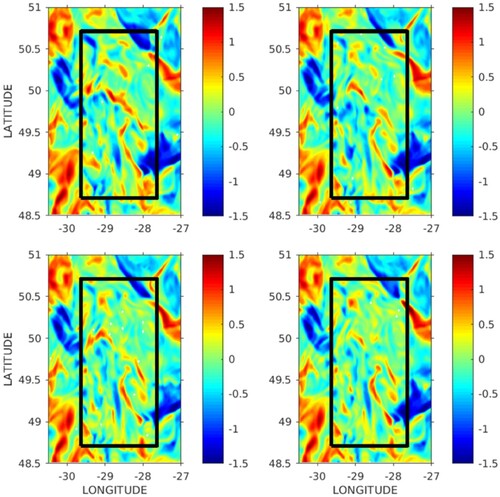
Figure 23. Model-observations innovations (colour dots) and analysis increments (colour contours) in temperature at 100 m depth on 1 December 2019 from each wintertime float deployment experiment: WIN-081 (upper left), WIN-156 (upper right), WIN-240 (lower left), and WIN-324 (lower right).
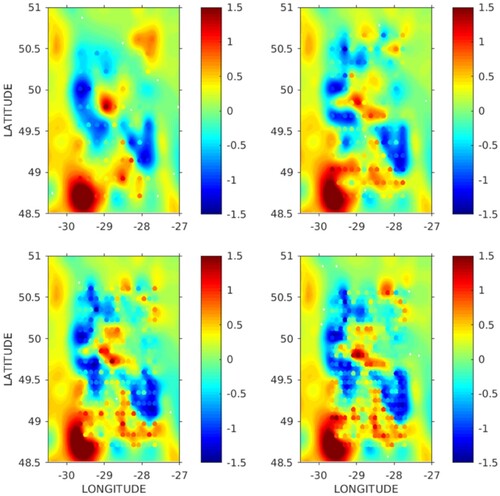
Figure 24. Temperature difference at 100 m depth between the NR and each wintertime float deployment experiment: WIN-081 (upper left), WIN-156 (upper right), WIN-240 (lower left), and WIN-324 (lower right). AOI outlined by black box.