
Figures & data
Figure 1. Preprocessing of scientific literature on raw data to obtain the final dataset. Information about exclusion is showed in the picture. Examples of not-relevant papers were infectious diseases and papers about the welfare of buffalo city (NY) population.
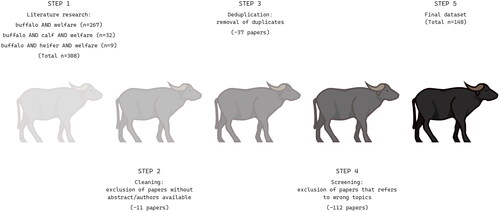
Figure 2. Peer-reviewed articles on the welfare of buffaloes published within the period 1992–2023.
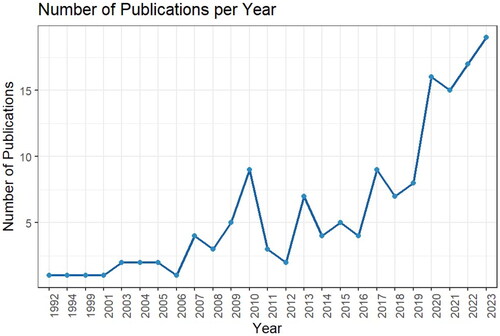
Figure 3. Distribution of published papers by journal name (with at least 2 papers published on the topic in the period considered).
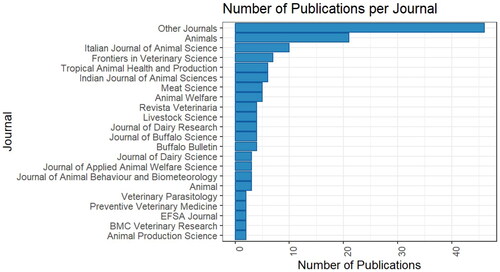
Figure 4. Graph bar depicting the distribution of the 148 scientific literature records selected for inclusion per continent (a) and country (b).
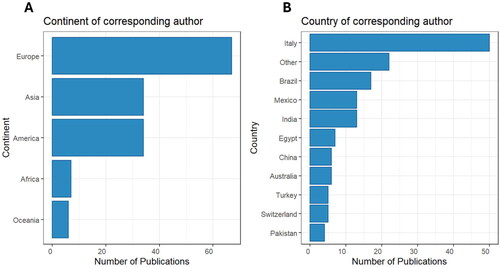
Figure 5. Histogram of the most relevant words based on their weight (TF-IDF >1) of 148 documents selected for inclusion in the study.
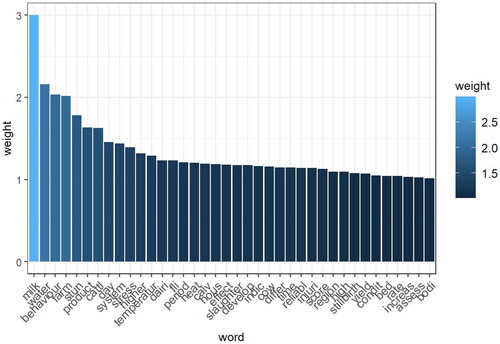
Figure 6. Word cloud with the most frequent words.
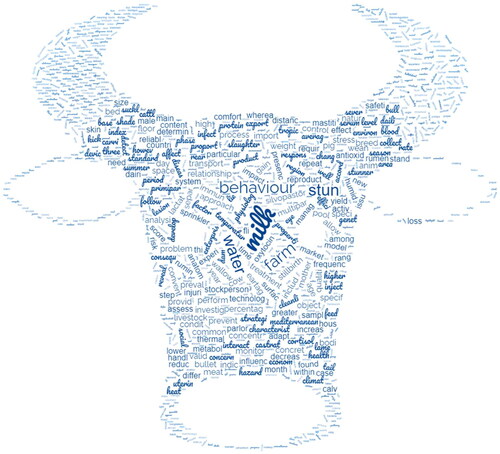
Table 1. Correlation about the most frequent words (TF-IDF ≥ 1) and the other words present in the documents analysed.
Figure 7. Result of topic analysis. For each topic the 10 most frequent words were shown. Some topics had more than 10 words because of the same beta value. Beta denoted the relative probability of each term belonging to that topic.
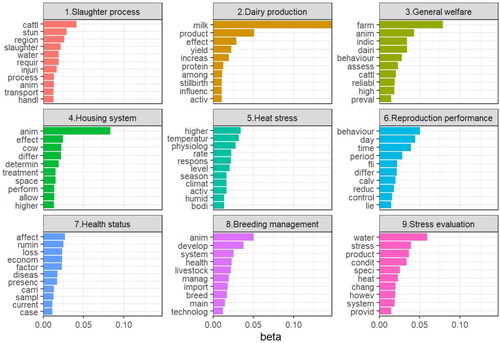
Table 2. Name of each topic, number of publications per topic, R2, p-value, country of prevalence and year of the first publications. The signs (+ or -) near the R2 denoted a positive or negative trend.
Data availability statement
Data will be shared on request.