
Figures & data
Figure 1. Distributions of named entities and nouns.
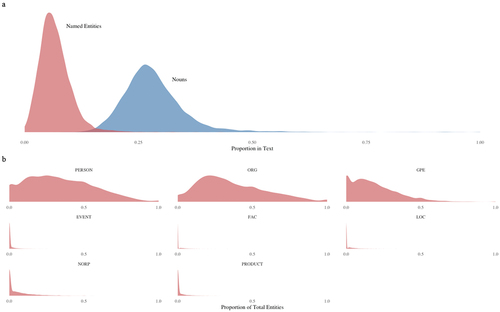
Figure 2. Box plots showing the difference in the number of “recommended” topics.
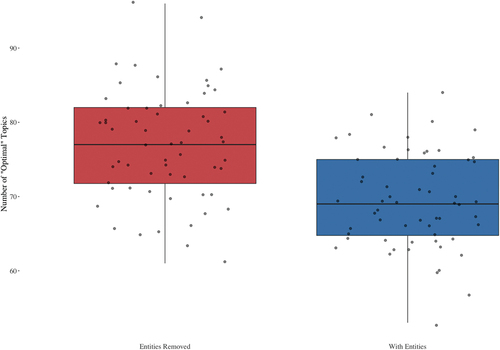
Table 1. Average frequency of named entities in top-15 words lists.
Figure 3. Box plots showing the differences in exclusivity and semantic coherence.
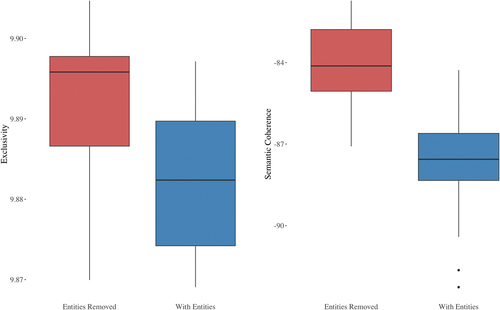
Figure 4. Box plots showing the differences in semantic coherence and held-out log-likelihood on cross-model prediction.
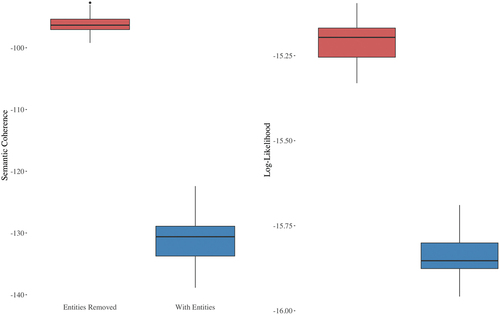
Figure 5. Box plot showing the differences in semantic coherence and exclusivity for each of the 5 overarching themes.
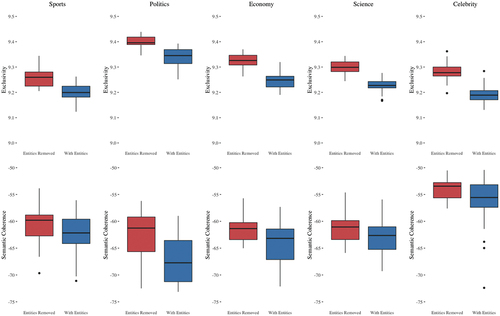
Figure 6. Posterior predicted probabilities for models I and II.
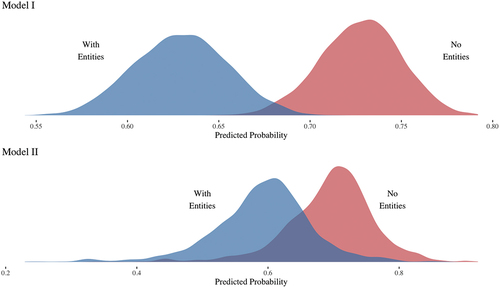
Table 2. Bernoulli model results predicting probability of a topic model to be judged as “interpretable”.
Figure 7. Empirical proportions of “interpretable” topics (panel A) and number of deleted words (panel B) for models trained on NE and removed NE Corpora. Barcharts include 95% CIs for binomial proportions.
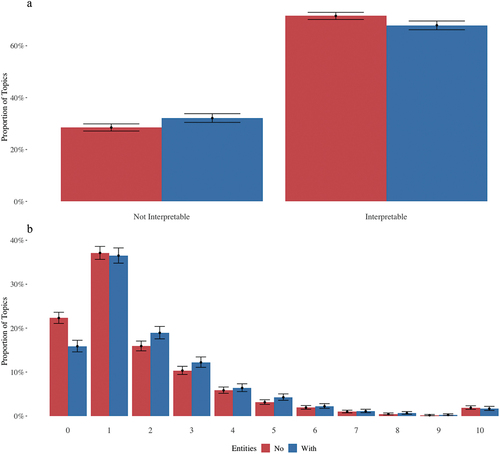
Table 3. Bernoulli model results predicting probability of a topic model to be judged as “interpretable”.
Figure 8. Posterior predicted probabilities of “interpretable” topics (panel A) and predicted binomial probabilities for an additional word to be removed (panel B) for models trained on NE and removed NE Corpora.
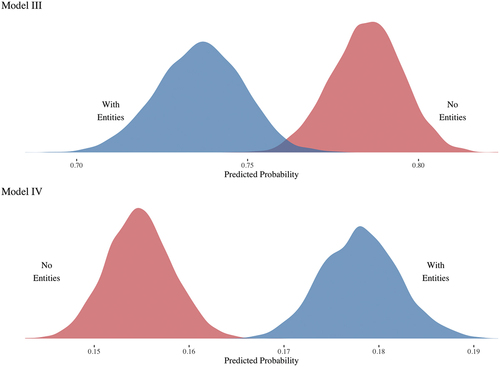
Figure 9. Panel (A): conditional effect of interaction of word position and word type on the probability of a word being removed from the top-10 list. Panel (B): proportion of words removed from the top-10 list by word position and word type.
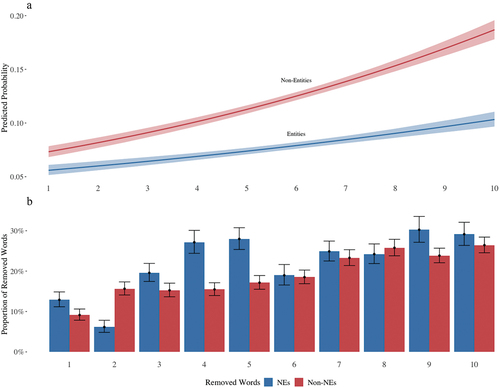
Table 4. Bernoulli model results predicting probability of a word being removed depending on its position and type.