
Figures & data
Figure 1. Domain organization of hnRNPs that have been structurally characterized using cryo-EM. The RNA recognition motifs (RRMs), low complexity domains (LCDs) and the nuclear localization signals (PY-NLS and NLS) are colored in orange, light blue and dark blue, respectively.
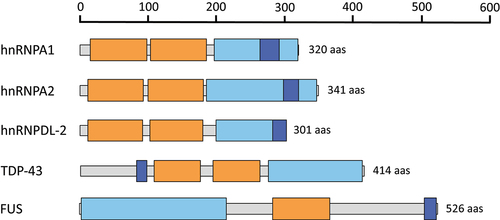
Figure 2. Impact of hnRNPA1 disease-associated mutations on fibril stability. (a) domain organization of hnRNPA1. Residues covered by the amyloid core in the cryo-EM hnRNPA1 fibril structure (PDB 7BX7) [Citation17] are indicated with a brown bar. (b-g) stabilization energy maps of the amyloid fibrils formed by the WT protein (b) and their corresponding disease-associated mutants D262V (c), D262N (d), N267S (e), P288A (f) and P288S (g). Note that amyloid fibril structures are colored by energy, being red and blue the stabilizing and destabilizing residues, respectively. In (a-g) the nature of the disease-associated mutations is indicated with green (stabilizing) or red (destabilizing) filled circles.
![Figure 2. Impact of hnRNPA1 disease-associated mutations on fibril stability. (a) domain organization of hnRNPA1. Residues covered by the amyloid core in the cryo-EM hnRNPA1 fibril structure (PDB 7BX7) [Citation17] are indicated with a brown bar. (b-g) stabilization energy maps of the amyloid fibrils formed by the WT protein (b) and their corresponding disease-associated mutants D262V (c), D262N (d), N267S (e), P288A (f) and P288S (g). Note that amyloid fibril structures are colored by energy, being red and blue the stabilizing and destabilizing residues, respectively. In (a-g) the nature of the disease-associated mutations is indicated with green (stabilizing) or red (destabilizing) filled circles.](/cms/asset/dc882a26-4ea0-4dec-8a2d-aa528a90c523/kprn_a_2329186_f0002_oc.jpg)
Figure 3. Impact of hnRNPA2 disease-associated mutations on fibril stability. (a) domain organization of hnRNPA2. Residues covered by the amyloid core in the cryo-EM hnRNPA2 fibril structure (PDB 6WQK) [Citation18] are indicated with a brown bar. (b-d) stabilization energy maps of the amyloid fibrils formed by the WT (b) and their corresponding disease-associated mutants D290V (c) and P298L (d). The structures are colored according to the energy values, as described in figure 2. In (a-d), the nature of the disease-associated mutations is indicated with green (stabilizing) or red (destabilizing) filled circles.
![Figure 3. Impact of hnRNPA2 disease-associated mutations on fibril stability. (a) domain organization of hnRNPA2. Residues covered by the amyloid core in the cryo-EM hnRNPA2 fibril structure (PDB 6WQK) [Citation18] are indicated with a brown bar. (b-d) stabilization energy maps of the amyloid fibrils formed by the WT (b) and their corresponding disease-associated mutants D290V (c) and P298L (d). The structures are colored according to the energy values, as described in figure 2. In (a-d), the nature of the disease-associated mutations is indicated with green (stabilizing) or red (destabilizing) filled circles.](/cms/asset/c939daa3-2fbd-4afd-b64c-0b42d587913f/kprn_a_2329186_f0003_oc.jpg)
Table 1. Calculated standard free energy of stabilization of disease-associated mutations in hnRNPs.
Figure 4. Impact of hnRNPDL-2 disease-associated mutations on fibril stability. (a) domain organization of hnRNPDL-2. The residues covered by the amyloid core in the cryo-EM hnRNPDL-2 fibril structure (PDB 7ZIR) [Citation25] are indicated with a brown bar. (b-d) stabilization energy maps of the amyloid fibrils formed by the WT (b) and their corresponding disease-associated mutants D259N (c) and D259H (d). The structures are colored according to the energy values, as described in figure 2. In (a-d), the nature of the disease-associated mutations is indicated with green (stabilizing) or red (destabilizing) filled circles.
![Figure 4. Impact of hnRNPDL-2 disease-associated mutations on fibril stability. (a) domain organization of hnRNPDL-2. The residues covered by the amyloid core in the cryo-EM hnRNPDL-2 fibril structure (PDB 7ZIR) [Citation25] are indicated with a brown bar. (b-d) stabilization energy maps of the amyloid fibrils formed by the WT (b) and their corresponding disease-associated mutants D259N (c) and D259H (d). The structures are colored according to the energy values, as described in figure 2. In (a-d), the nature of the disease-associated mutations is indicated with green (stabilizing) or red (destabilizing) filled circles.](/cms/asset/12f9d590-b596-4c95-b8be-85a9c0628a44/kprn_a_2329186_f0004_oc.jpg)
Figure 5. Impact of TDP-43 disease-associated mutations on fibril stability. (a) domain organization of TDP-43. The residues encompassed by the amyloid core of two ex vivo fibril structures of TDP-43, derived from patients with ALS-FTLD (PDB 7PY2) [Citation27] and type A FTLD-TDP (PDB 8CG3) [Citation28], are indicated with brown bars. b-k) stabilization energy maps of the ALS-FTLD (b-f) and type A FTLD-TDP (g-k) amyloid fibrils. The structures of the WT (b and g) and their corresponding disease-associated mutants A315E (c and h), A315T (d and i), M337V (e and j) and Q331K (f and k) are shown. The structures are colored according to the energy values, as described in figure 2. In a-k), the nature of the disease-associated mutations is indicated with green (stabilizing) or red (destabilizing) filled circles.
![Figure 5. Impact of TDP-43 disease-associated mutations on fibril stability. (a) domain organization of TDP-43. The residues encompassed by the amyloid core of two ex vivo fibril structures of TDP-43, derived from patients with ALS-FTLD (PDB 7PY2) [Citation27] and type A FTLD-TDP (PDB 8CG3) [Citation28], are indicated with brown bars. b-k) stabilization energy maps of the ALS-FTLD (b-f) and type A FTLD-TDP (g-k) amyloid fibrils. The structures of the WT (b and g) and their corresponding disease-associated mutants A315E (c and h), A315T (d and i), M337V (e and j) and Q331K (f and k) are shown. The structures are colored according to the energy values, as described in figure 2. In a-k), the nature of the disease-associated mutations is indicated with green (stabilizing) or red (destabilizing) filled circles.](/cms/asset/2c6f9f22-532d-451c-8902-d5d873eb4202/kprn_a_2329186_f0005_oc.jpg)
Figure 6. Impact of FUS disease-associated mutations on fibril stability. (a) domain organization of FUS. The residues covered by the amyloid core in the cryo-EM FUS fibril structure (PDB 7VQQ) [Citation24] are indicated with a brown bar. (b-d) stabilization energy maps of the amyloid fibrils formed by the WT protein (b) and their corresponding disease-associated mutants P106L (c) and S115N (d). The structures are colored according to the energy values, as described in figure 2. In a-d), the nature of the disease-associated mutations is indicated with green (stabilizing) or red (destabilizing) filled circles.
![Figure 6. Impact of FUS disease-associated mutations on fibril stability. (a) domain organization of FUS. The residues covered by the amyloid core in the cryo-EM FUS fibril structure (PDB 7VQQ) [Citation24] are indicated with a brown bar. (b-d) stabilization energy maps of the amyloid fibrils formed by the WT protein (b) and their corresponding disease-associated mutants P106L (c) and S115N (d). The structures are colored according to the energy values, as described in figure 2. In a-d), the nature of the disease-associated mutations is indicated with green (stabilizing) or red (destabilizing) filled circles.](/cms/asset/5998e0c0-4c96-4c24-bda1-e44ed4469085/kprn_a_2329186_f0006_oc.jpg)
Data availability statement
Data sharing does not apply to this article as no new data were created or analysed in this study.