Figures & data
Table 1. gRNA sequence information.
Table 2. nPOD donor sample information.
Table 3. qPCR primers.
Figure 1. PDX1 and SND1 interact in rodent and human β cell lines and primary β cells. (a) co-immunoprecipitation of PDX1 or SND1, followed by immunoblotting for PDX1 and SND1 in INS-1 832/13 and βTC3 nuclear extracts. (b-d) proximity ligation assays (PLAs) using antibodies for SND1 and PDX1 were performed on (b) 12-week-old C57BL/6J, (c) human EndoC-βH1 β cells, and (d) 51-year-old non-diabetic male donor tissues acquired from nPOD (donor # 6168). The images on the right in b-d are magnified regions outlined in the yellow box. The white, fluorescent foci from the PLA represent individual PDX1:SND1 interactions. (scale bars = 10 μm).
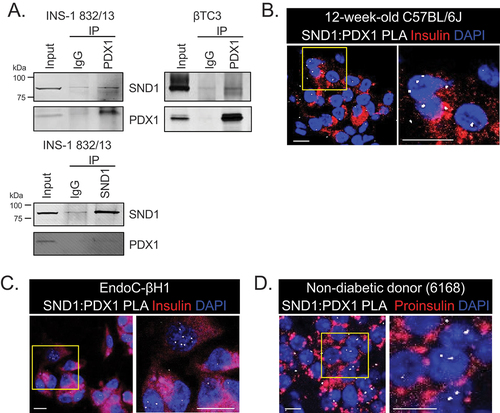
Figure 2. Reduction in Snd1 negatively impacts glucose-stimulated insulin secretion in rodent and human β cell lines. Immunoblot of nuclear extracts from siControl and siSnd1 treated INS-1 832/13 (a) and EndoC-βH1 (d) cells demonstrate significant reductions of SND1. Quantitation of SND1 protein levels normalized to β-ACTIN shown to the right. (b) glucose-stimulated insulin secretion in siSnd1 cells is blunted in INS-1 832/13 (b) and EndoC-βH1 (e) cells with no change in insulin content (c, f). (n = 3–5). ns, not significant; *, p < 0.05; ****, p < 0.0001.
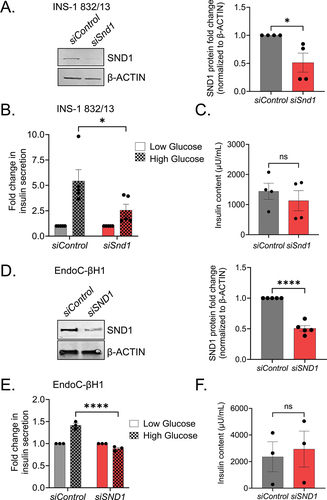
Figure 3. SND1 controls a subset of genes important for β cell expansion and function. (a) immunoblot of nuclear extracts for SND1 and β-ACTIN from clonal CRISPR/Cas9 intron - control and exon 2 - Snd1 KO cell lines. (b) volcano plot illustrating the most differentially expressed genes in Snd1 KO β cell lines. (c Heatmap hierarchical clustering displaying log2(Fold change) of select subset of differentially expressed genes in Snd1 KO β cells. (d) qPCR performed on independently isolated RNA from control and Snd1 KO cell lines. (e) biological processes of the 159 differentially expressed genes identified by gene ontology (GO) analysis include those associated with insulin secretion, cAMP biosynthesis, and cell proliferation. (f) qPCR of select subset of genes following siRNA-mediated depletion of SND1 from EndoC-βH1 cells. *, p < 0.05; **, p < 0.01.
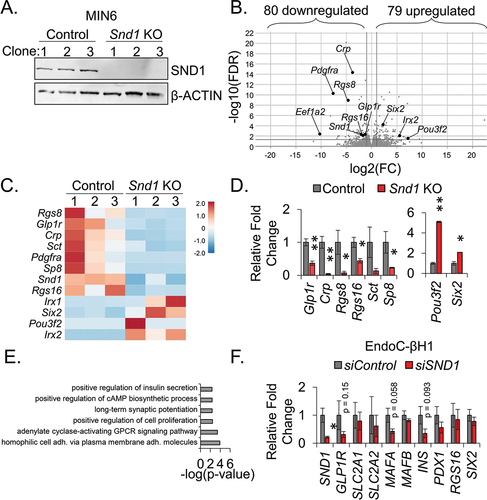
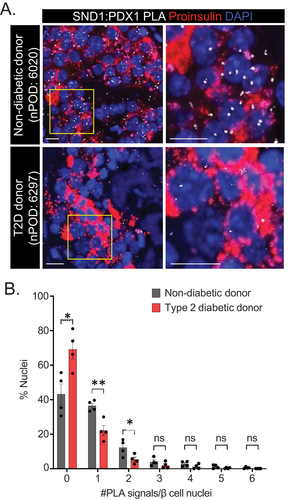
Figure 4. PDX1:SND1 interactions are negatively impacted in T2D human β cells. (a) Representative PDX1:SND1 PLA and proinsulin images acquired from human pancreatic tissue sections from non-diabetic donor (nPOD case #: 6020: 60 years old male, BMI = 29.8) and T2D donor (nPOD case#: 6297: 60 years old male, BMI = 29.5, 3 years T2D duration). (b) quantitation of PLA signals in each group stratified by number of PLA signals per β cell nuclei. The images to the right in (a) are magnified regions outlined in the yellow box above. (n = 4). ns, not significant; *, p < 0.05; **, p < 0.01. (scale bars = 10 μm).