

Figures & data
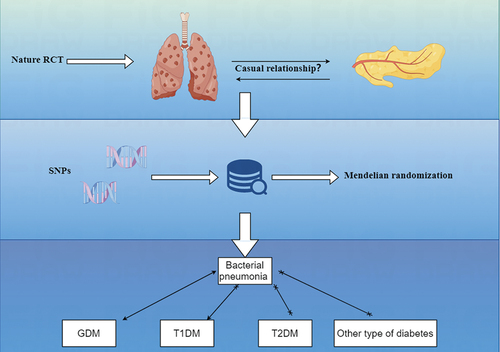
Figure 1. Research flow chart. MR test needs to meet four assumptions at the same. time. First, SNPs must be strongly correlated with exposure. Second, SNPs cannot be directly related to outcome. Third, SNPs cannot be associated with any possible confusing factors. Last, no genetic assortative mating.
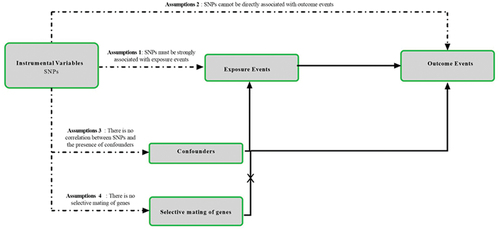
Figure 2. What the relationship between bacteria pneumonia and diabetes?.
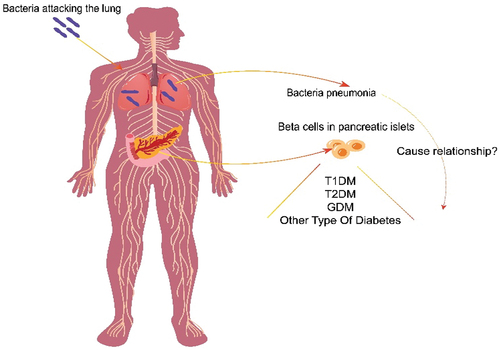
Figure 3. The results of IVW, MR-Egger regression, and weighted median analysis of bacterial pneumonia on diabetes.
Figure 4. Scatter plots of MR analysis. (a) exposure bacterial pneumonia and outcome GDM; (b) exposure bacterial pneumonia and outcome T1DM; (c) exposure bacterial pneumonia and outcome T2DM; (d) exposure bacterial pneumonia and outcome other type of diabetes.
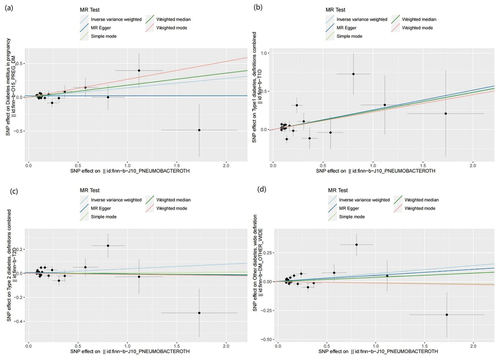
Figure 5. Leave one out analysis results. (a) exposure bacterial pneumonia and outcome GDM; (b) exposure bacterial pneumonia and outcome T1DM; (c) exposure bacterial pneumonia and outcome T2DM; (d) exposure bacterial pneumonia and outcome other type of diabetes.
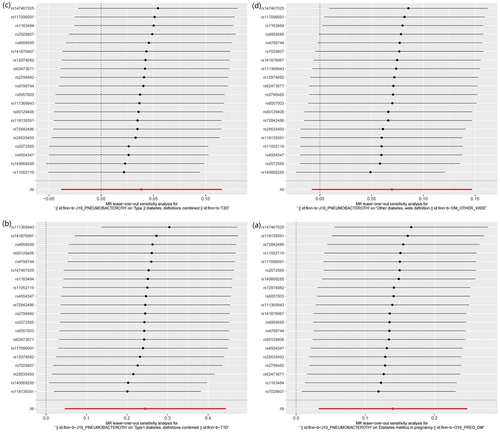
Table 1. Summary of GWAS data characteristics in the two-sample MR.
Table 2. The results of the heterogeneity analysis.
Figure 6. The results of IVW, MR-Egger regression, and weighted median analysis of diabetes on bacterial pneumonia.
Figure 7. Scatter plots of MR analysis. (a) exposure GDM and outcome bacterial pneumonia; (b) exposure T1DM and outcome bacterial pneumonia; (c) exposure T2DM and outcome bacterial pneumonia; (d) exposure other type of diabetes and outcome bacterial pneumonia.
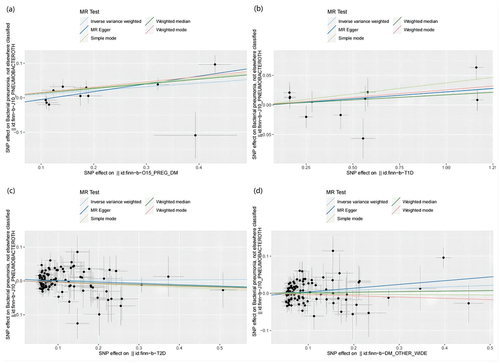
Figure 8. Leave one out analysis results. (a) exposure GDM and outcome bacterial pneumonia; (b) exposure T1DM and outcome bacterial pneumonia; (c) exposure T2DM and outcome bacterial pneumonia; (d) exposure other type of diabetes and outcome bacterial pneumonia.
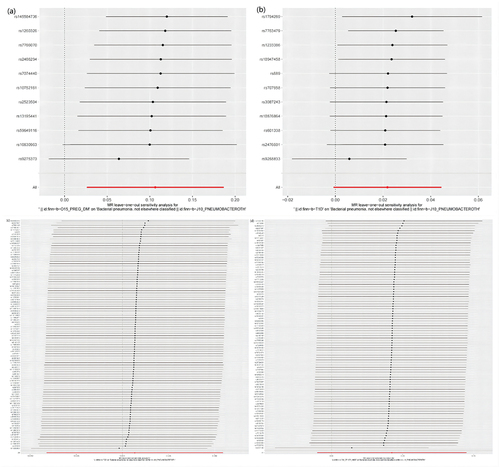
Table 3. The results of the heterogeneity analysis.

