

Figures & data
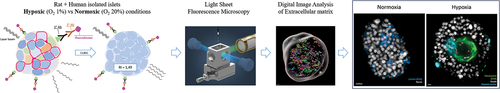
Figure 1. Workflow of the study. (a) Islet culture in different oxygenation conditions. (b) Fixation and storage. (c) Immunofluorescence:: permeabilization, unspecific site blockage, primary and secondary antibodies incubation (3 and 7 days each, for human and rat islets, respectively). (d) Using the CUBIC approach, refractive indexes homogenization. (e) Embedding of fluorescent and transparent islets in agarose and aspiration in a capillary. (f) Positioning of the islets, in an agarose rod, inside the imaging chamber of the LSFM (adapted from Zeiss® z.1 user manual). (g) Imaging of sequential virtual sections. (h) Image processing: 3D region of interest (gray) containing volumes stained for fibronectin.
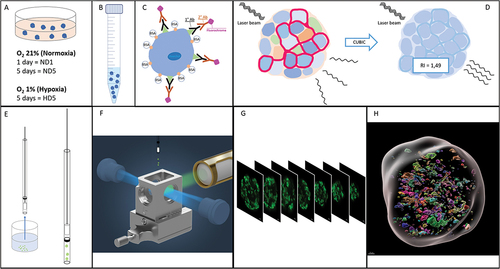
Figure 2. Comparison of imaging quality using LSFM and confocal microscopies. The same human islet was imaged with both microscopes, with if for insulin (green) and nuclei (Hoechst, white). The position varies as it is impossible to acquire systematically from the same angle with two different microscopes. Bottom left of each data set: 2D cross-section in the middle of the islet (X/Y view). Top-left and bottom right: X/Z and Y/Z orthogonal projections. Top right (red square): magnification of Hoechst-labeled nuclei in X/Y. Image resolution was superior in confocal microscopy, with overall crispier staining. However, this was detrimental to proper nuclear segmentation in DIA, requiring additional pre-processing steps. Orthogonal projections highlight the flattening of the sample in z and spherical aberrations when using confocal microscopy.
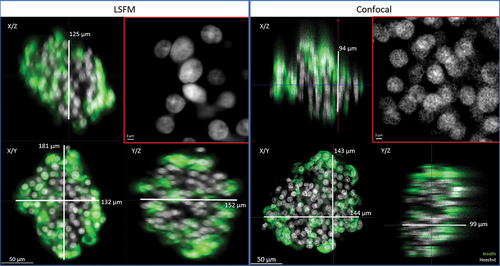
Figure 3. Left and central panels: representative 2D cross-sections in the middle of the human islets, with if for CA9 and Hoechst. CA9 is a trans-membrane protein, used here as a marker of hypoxia. Its presence after 5 days in normal culture conditions was sporadic (left), while under hypoxic conditions (group HD5, right), it could be found in all islets, expressed in large areas. Note the alteration in nuclear shape in areas around hypoxia. Right panel: quantification of CA9, expressed as percentage of total islet volume, showing significant presence of CA9 after 5 days in hypoxia.
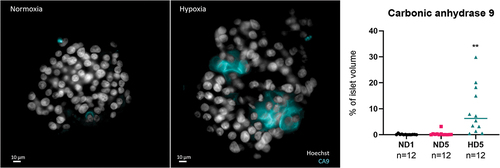
Figure 4. Comparison of the quantification of rat islets’ insulin content with two different techniques. (a and c) percentage of volume occupied by insulin or glucagon inside the islet, determined by Digital Image Analysis. (b and d) weight of these proteins measured by radioimmunoassay, expressed as a percentage of DNA content.
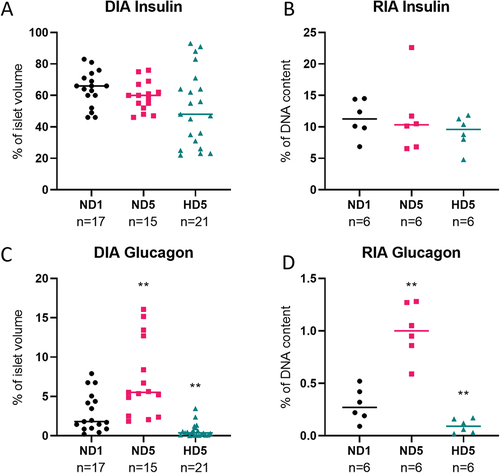
Figure 5. Digital Image Analysis process. (a) 3D projection of an islet before processing; (b) 3D projection of a region of interest, used to calculate total islet volume. (c) 2D projection showing target protein (insulin) identified using a standardized intensity threshold; (d) 3D projection of the target protein stained volume.
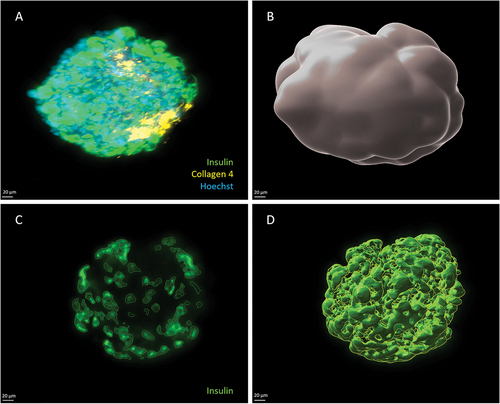
Figure 6. Summary of quantifications of protein content in human islets using DIA. Each dot in the graph represents an islet, and horizontal lines represent the mean value of the set. Statistical significance is shown with a *. (a) Islet volume did not differ significantly amongst groups. (b – e) target protein abundance expressed as a percentage of total islet volume. Means do not differ significantly, especially after 5 days of culture (p > .05).
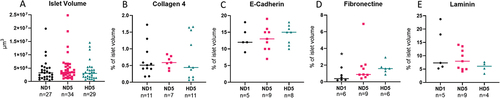
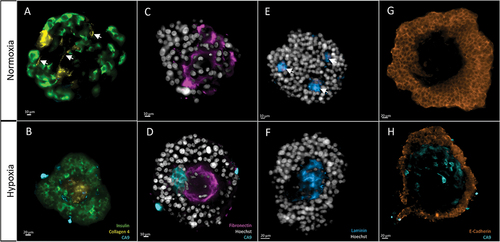
Figure 7. Morphological analysis of target proteins in human islets, after 5 days of either normoxia (top row) or hypoxia (bottom row). 2D cross sections in the middle of the islets. The same display parameters are identical for each protein. (a) Collagen 4 can be found in structures resembling blood vessels in group ND5 (arrows). (b) Central scar showing condensed Collagen 4 stain; note hypoxic cells (CA9-positive) around this area. (c) Fibronectin is found throughout the islet in normoxic conditions. (d) In hypoxia, it accumulates in the center of the islet, in the fashion of scarring tissue. This last picture is also a clear example of what we name architectural loss: ECM condensation, and scarce nuclei, which also present altered morphology, like irregular shape and small size. Note the presence of hypoxic cells (CA9) around the fibrotic core. (e) Laminin forms small, scattered nodes in normoxic conditions. (f) In hypoxia, it is found in central scars. (g) E-cadherin, a membrane marker, is found in the outer layers of islets while avoiding central areas. H) these holes in the signal are more evident in hypoxic conditions, where the central area can be populated by hypoxic cells (CA9-positive).
Supplemental Material
Download Zip (622 KB)Data availability statement
Images, including individual metadata and performed analyses, are available and free for use at https://doi.org/10.14428/DVN/GVARMX

