Figures & data
Table 1. List of primers used.
Figure 1. Glis3 mRNA is reduced under conditions of chronically elevated glucose. (a) INS1 832/13 cells were grown in media containing either 3 mM or 25 mM glucose. After 24 h, RNA was harvested, converted to cDNA, and gene expression was measured by qRT-PCR using the indicated primers. Relative mRNA expression for each gene was measured in triplicate and normalized to 18s rRNA. Bars represent average fold change of expression from cells grown in 25 mM glucose compared to cells grown in 3 mM glucose ±SD. * represents statistical difference from cells grown in 3 mM glucose (p < .05). Grey dots represent fold change from individual experiments. (b–d). INS1 832/13 cells were grown in media containing either 3 mM, 11.1 mM, or 25 mM glucose. After 24 h, RNA was harvested, converted to cDNA, and gene expression of the indicated target was measured by qRT-PCR as described in A. * represents statistical difference from cells grown in 3 mM glucose. # indicates statistical difference compared to cells maintained in both 3 mM and 11.1 mM glucose (p < .05).
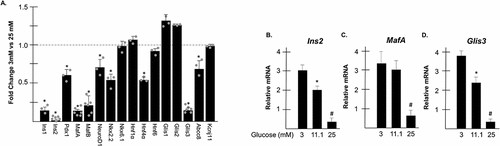
Figure 2. Glis3 transcript levels are influenced by oxidative stress. A-B. INS1 832/13 cells were plated in glass bottom dishes in media containing either 3 mM or 25 mM glucose. After 48 h, cells were incubated in the presence of 10 µM CM-H2DCFDA for 30 min, washed in PBS, and imaged by fluorescence microscopy (a) or resuspended in PBS and the oxidized intracellular fluorescent reporter was quantified by a microplate reader (b). The mean arbitrary units of fluorescence measured in triplicate from two replicates for each condition are reported ± SD after subtracting background autofluorescence. * indicates statistical difference from vehicle treated cells maintained in 3 mM glucose (p < .05). (c) INS1 cells were grown in media containing either 3 mM or 25 mM glucose with the addition of the indicated concentration of H2O2 or 4-hydroxy-TEMPO. After 24 h, RNA was harvested and Glis3 expression was measured by qRT-PCR. Representative experiments are shown. Bars represent relative Glis3 expression from triplicate samples normalized to 18s rRNA ± SD. * indicates statistical difference from vehicle treated cells maintained in 3 mM glucose. # indicates statistical difference from vehicle treated cells maintained in both 3 mM and 25 mM glucose (p < .05).
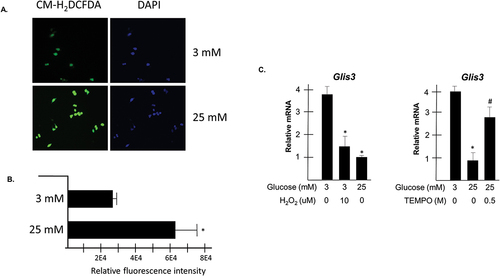
Figure 3. Glis3 influences insulin and MafA expression. (a) INS1 832/13 cells were transfected with empty vector or pCMV10-3×FLAG-Glis3 and grown in media containing 25 mM. After 24 h, RNA was harvested, converted to cDNA, and gene expression was measured by qRT-PCR using the indicated primers. Relative mRNA expression for each gene was measured in triplicate and normalized to 18s rRNA. Bars represent average fold change of expression from cells transfected with 3×FLAG-Glis3 compared to empty vector ± SD. Grey dots represent fold change from individual experiments. * represents statistical difference from cells transfected with empty vector. (b) A map of the Glis3 gene locus in rat. Exons are numbered 2–12 along with the relative position of the start and stop codons. Size of introns in bp are shown above. The locations of the regions that encode for the DBD and TAD are indicated. The targets of the two gRNA within exon 3 are shown with the PAM sequences in blue font. (c) RNA was collected from INS1 832/13 or Glis3EX3del mutants as indicated and Glis3 expression was measured by qRT-PCR using primers that target either exon 2 or the gRNA-targeted region of exon 3. Bars represent relative Glis3 expression from triplicate samples normalized to 18s rRNA ± SD. (d) A representative 2% agarose gel is shown to the right containing a PCR amplicon from the indicated cell line using primers that flank the gRNA-targeted region of Glis3 exon 3. Expected size = 219 bp. Mutated size = 175 bp. E. INS1 832/13 or Glis3EX3del mutant cells were grown in media containing 3 mM glucose. After 24 h, RNA was harvested and RT-PCR was carried out as described in A. Bars represent average fold change of expression from Glis3EX3del cells compared to INS1 controls. Grey dots represent fold change from individual experiments. * represents statistical difference from INS1 control expression (p < .05).
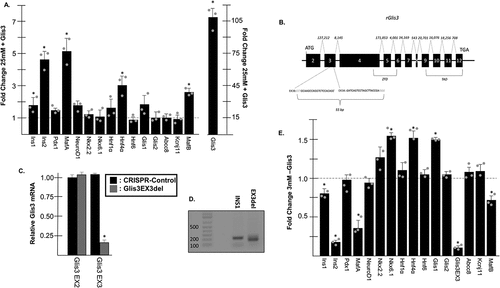
Figure 4. Glis3 positively regulates MafA expression through its pancreas-specific enhancer. (a) Schematic diagram of the MafA upstream regulatory regions. The regions defining the core promoter (6) and the pancreas-specific enhancer (3) are shown in bp relative to the TSS. (b,d) INS1 832/13 cells were transfected with pCMV-β-Gal, the indicated luciferase reporter construct, and the specified Glis3 expression vector. After 48 h, cells were assayed for luciferase and β-galactosidase activity and the normalized relative luciferase activity (nRLU) was calculated and plotted. Representative experiments are shown. Each bar represents the mean ± S.D. * indicates statistically different than cells expressing empty vector (p < .05). NCR = N-terminal conserved region; ZFD = zinc finger domain; TAD = transactivation domain. (c) Five putative GlisBS were identified within the pancreas-specific R3 enhancer. Underlined bases indicate core GlisBS sites conserved between mouse, rat, and human. Position of each element is indicated in bp relative to the MafA TSS.
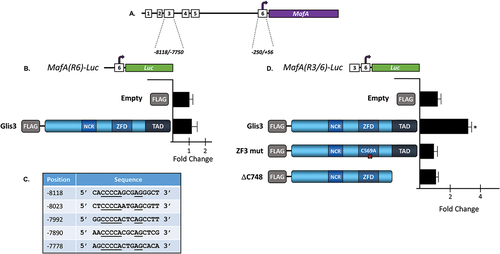
Figure 5. MafA expression is reduced in Glis3EX3del mutant cells. (a) INS1 or Glis3EX3del mutant cells were grown on glass bottom dishes and 24 h later cells were fixed and stained with rabbit anti-MafA primary antibody and an anti-rabbit AlexaFluor-594 secondary antibody. Nuclear staining was acquired using DAPI. (b) INS1 or Glis3EX3del mutants were grown for 24 h and proteins were separated by SDS-PAGE and analyzed by Western blotting using rabbit anti-MafA or mouse anti-β-actin primary antibodies and HRP-conjugated secondary antibodies. (c) INS1 cells were transfected with empty vector or pCMV10-3xFLAG-Glis3 and 24 h later proteins were separated by SDS-PAGE and analyzed by Western blotting as described in B.
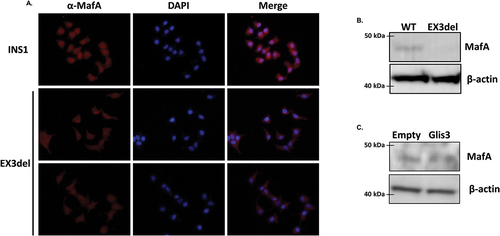
Figure 6. MafA positively influences Glis3 transcription. (a) INS1 832/13 cells were transfected with empty vector or pCMV6-Myc-DDK-MafA and grown in media containing 25 mM glucose. After 24 h, RNA was harvested, converted to cDNA, and gene expression was measured by qRT-PCR using the indicated primers. Relative mRNA expression for each gene was measured in triplicate and normalized to 18s rRNA. Bars represent average fold change of expression from cells transfected with Myc-DDK-MafA compared to empty vector ±SD. Grey dots represent fold change from individual experiments. * represents statistical difference from cells transfected with empty vector (p < .05). (b) INS1 or Glis3EX3del mutant cells were transfected with the indicated plasmids and maintained in media containing 25 mM glucose. After 24 h, RNA was harvested and Ins2 expression was measured by qRT-PCR. Bars represent relative Ins2 expression from triplicate samples normalized to 18s rRNA ± SD. * indicates statistical difference from INS1 cells transfected with empty vector. # indicates statistical difference from INS1 and Glis3EX3del mutant cells transfected with empty vector (p < .05).
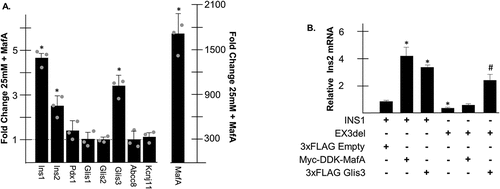
Figure 7. Glis3 behaves like a pioneer factor at the Ins2 promoter. (a) Schematic diagram of the mouse Ins2 promoter. TATA: TATA-box; A: Pdx1 binding site; E: NeuroD1/β2 binding site; C: MafA binding site; G: Glis3 binding site. Positions are indicated in bp relative to the Ins2 TSS. (b) INS1 832/13 cells were transfected with empty vector or pCMV10-3xFLAG-Glis3 as indicated and grown in media containing the specified concentration of glucose. After 48 h, a ChIP assay was performed and RT-PCR was used to determine the relative copies of the Ins2 or GAPDH promoter regions in the resulting purified DNA. Bars represent the percentage of each specified promoter relative to input ±SD. (c) INS1 832/13 cells were transfected with empty vector or pCMV10-3xFLAG-Glis3 as indicated and grown in media containing the specified concentration of glucose. After 48 h, cells were crosslinked in 1% formaldehyde, quenched with glycine, and sonicated. DNA was extracted in phenol-chloroform-isoamyl alcohol, ethanol precipitated, and purified using spin columns. Purified DNA was analyzed by RT-PCR to determine the relative amount of Ins2 promoter in each sample. Bars represent the average percentage of DNA recovered relative to input from triplicate samples ± SD. * indicates statistical difference from cells transfected with empty vector grown in 3 mM glucose (p < .05).
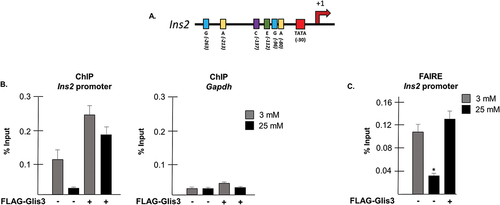
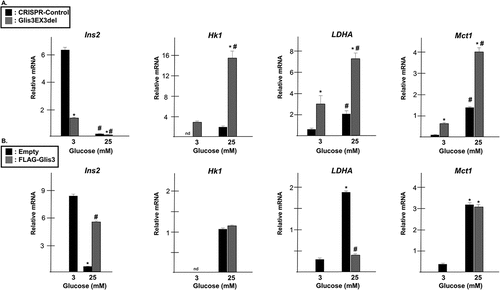
Figure 8. Expression of β cell “disallowed genes” increases in Glis3EX3del mutant cells. (a) INS1 or Glis3EX3del mutant cells were grown in media containing the indicated glucose concentration. After 24 h, RNA was harvested, converted to cDNA, and gene expression was measured by qRT-PCR using the indicated primers. Relative mRNA expression for each gene was measured in triplicate and normalized to 18s rRNA. Bars represent relative mRNA expression from triplicate samples normalized to 18s rRNA ± SD. * indicates statistical difference from INS1 control cells grown in media containing 3 mM glucose. # indicates statistical significance from paired cells maintained in 3 mM glucose (p < .05). (b) INS1 832/13 cells were transfected with empty vector or pCMV10-3xFLAG-Glis3 and grown in media containing the indicated glucose concentration. After 24 h, RNA was harvested, converted to cDNA, and gene expression was measured by qRT-PCR as described above. * indicates statistical difference from control cells maintained in 3 mM glucose. # indicates statistical difference from control cells maintained in 25 mM glucose (p < .05).