
Figures & data
Table 1. Units and dimensions of the physical quantities involved in the mathematical model for the prediction of density through the dimensional analysis of selective laser melting.
Figure 1. SEM images of Inconel alloy 718 (In718-0405) on a) at 200 X and b) at 500 X magnifications. The powder exhibits a spherical morphology.
Table 2. In718 (In718–0405, Renishaw, Monterrey, México) metal powder chemical composition (Renishaw Citation2017.).
Table 3. Experimental data for the validation of the mathematical model hereby developed.
Figure 2. Influence of the independent dimensionless products a) 1 and b)
2 in the dimensionless form of density,
0, respectively.
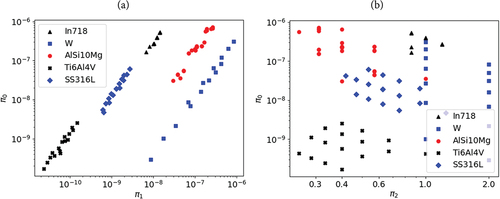
Table 4. Fitting parameters (C, α and β) values determined through the non-linear least-squares method alongside the R-squared value and the independent dimensionless groups (π1 and π2) working range.
Figure 3. Contour plot indicating isolines of SLEC, shown in solid blue lines, with its associated value of laser power, represented by dashed black lines. The plots illustrate the selection of scanning speed, and hatch distance, depending on a chosen value of power or SLEC for the SLM manufacturing of highly dense components in a) In718, b) W, c) AlSi10Mg, d) Ti6Al4V, and e) SS316L.
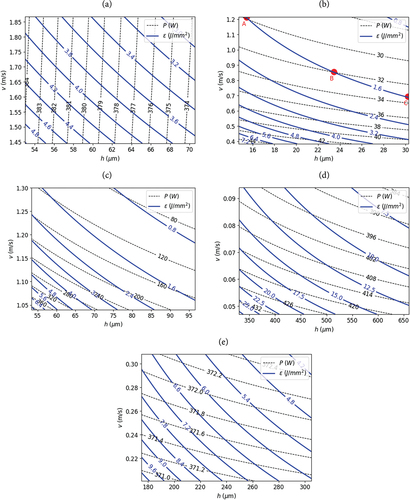
Table 5. SLEC (ε), scanning speed (v), hatch distance (h), laser power (P) and area scanning velocity (vA) associated with the A, B and C points in .
Figure 4. Processed SEM images of metallic powder material of (a) In718, (b) W, (c) AlSi10Mg, (d) Ti6Al4V and (e) SS316L for the calculation of fractal dimension and lacunarity through the differential box counting method.
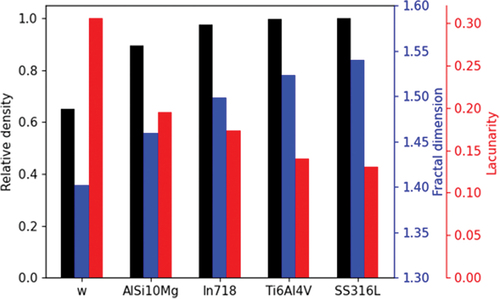
Figure 5. Fractal dimension (in blue), lacunarity (in red) and average relative densification attained (in black) for W, AlSi10Mg, In718, Ti6Al4V and SS316L SLMed metallic alloy powders.
Supplemental Material
Download MS Word (28.9 KB)Data availability statement
The authors confirm that the data supporting the findings of this study are available within the article and its supplementary materials.
