Figures & data
Table 1. Combined school target population: Survey sample.
Figure 1. Student learning and well-being: Average Likert rating.
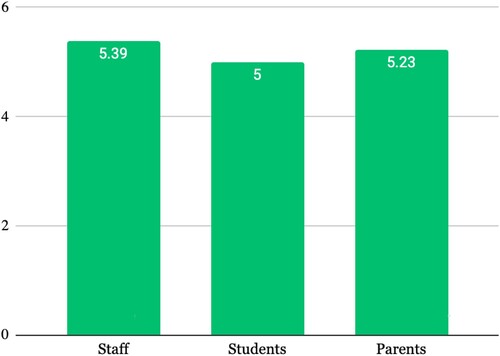
Figure 2. Student learning and well-being – negative and positive comment ratio.
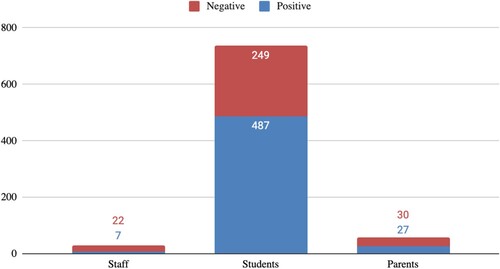
Figure 3. Physical Learning Environment: Average Likert ratings.
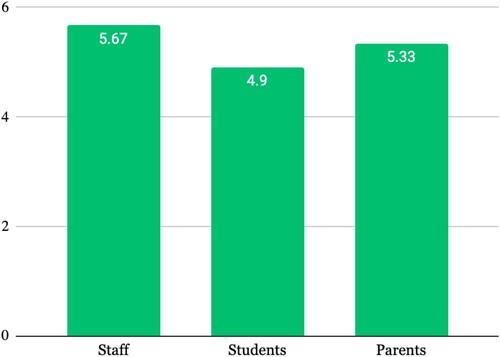
Figure 4. Physical Learning Environment – negative and positive comment ratio.
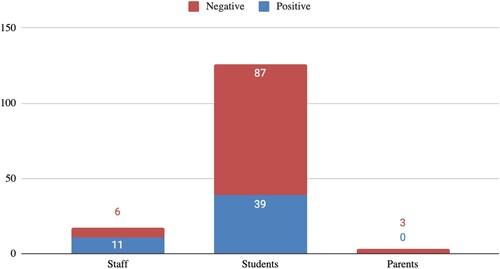
Figure 5. Leadership and administration: Average Likert ratings.
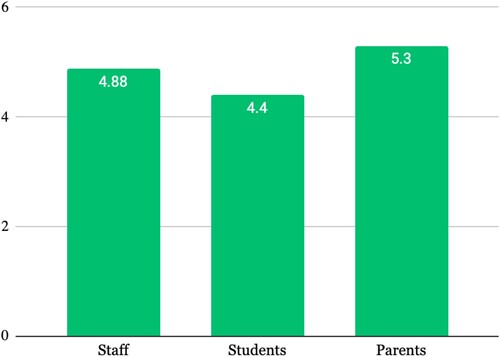
Figure 6. Leadership and administration – negative and positive comment ratio.
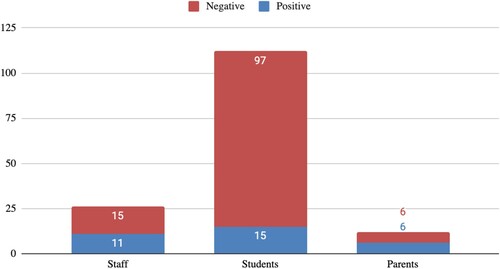
Figure 7. A framework for Conceptualising Catholic school amalgamations.