Figures & data
FIGURE 1. Fishing effort and Blue Shark (BSH) size (FL, cm) recorded by Taiwanese observers on longline fishing vessels operating in the South Atlantic from 2004 to 2013. The color scale within grid cells represents fishing effort, with darker blue representing more hooks and lighter blue representing fewer hooks. The size of the red dots indicates the mean FL categorized using 25th percentiles of the data.
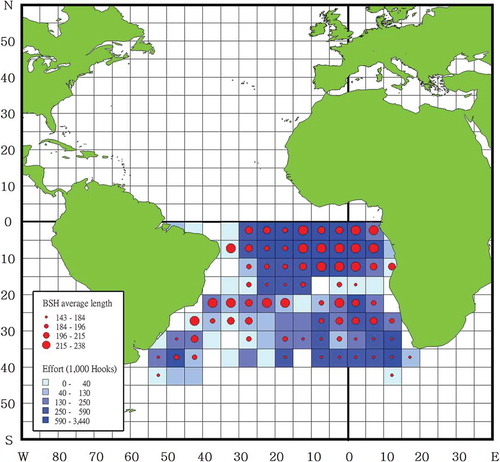
TABLE 1. Sample sizes and TL ranges of Blue Shark specimens that were captured from the South Atlantic (2006–2011) and used for age analyses.
FIGURE 2. An example X-ray image of a Blue Shark vertebral centrum (from a female, 205 cm TL) magnified by Adobe Photoshop CS4 version 11.0 and displayed on screen. The number of growth band pairs is depicted; R = the radius.
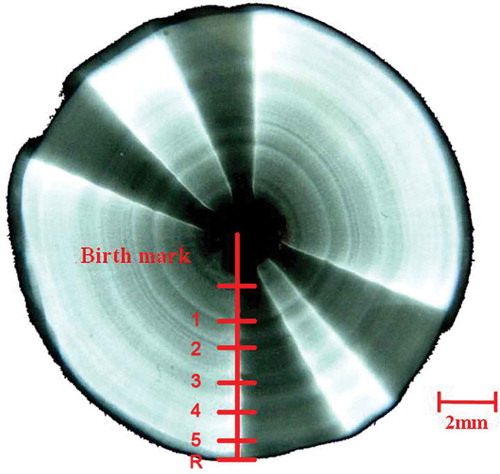
FIGURE 3. Length frequency distribution (FL, cm) of Blue Shark specimens captured by Taiwanese longline fleets in two areas of the South Atlantic: (a) the equatorial–tropical area and (b) the subtropical–temperate area (black bars = males; open bars = females; hatched bars = individuals of unknown sex).
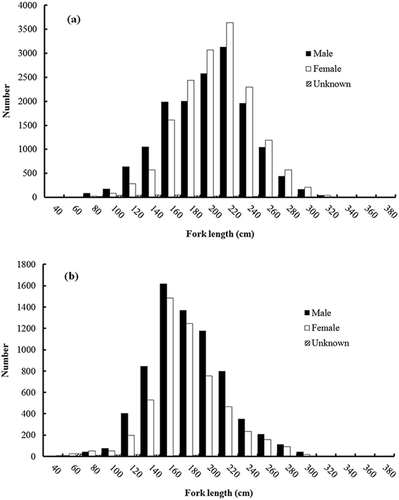
FIGURE 4. Length frequency distribution (TL, cm) of Blue Shark specimens that were used for age and growth analyses in this study (black bars = males; open bars = females; hatched bars = individuals of unknown sex).
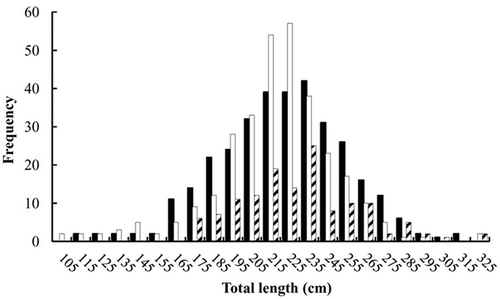
FIGURE 5. Seasonal fishing effort and Blue Shark (BSH) size (FL, cm) recorded by Taiwanese observers on longline fishing vessels operating in the South Atlantic from 2004 to 2013 (seasons are defined in Methods). The color scale within grid cells represents fishing effort, with darker blue representing more hooks and lighter blue representing fewer hooks. The size of the red dots indicates the mean FL categorized using 25th percentiles of the data.
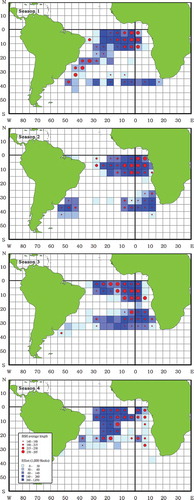
FIGURE 6. Annual mean (±SD) catch at size (FL, cm) for Blue Sharks captured by Taiwanese longline fleets operating in two areas of the South Atlantic from 2004 to 2013: (a) the equatorial–tropical area and (b) the subtropical–temperate area (the number above [females] or below [males] each data point is the sample size).
![FIGURE 6. Annual mean (±SD) catch at size (FL, cm) for Blue Sharks captured by Taiwanese longline fleets operating in two areas of the South Atlantic from 2004 to 2013: (a) the equatorial–tropical area and (b) the subtropical–temperate area (the number above [females] or below [males] each data point is the sample size).](/cms/asset/e82bf86a-3ca5-43d7-b98b-eff1ceb571a3/umcf_a_1249579_f0006_oc.jpg)
FIGURE 7. Age bias plot of vertebral band pair counts for Blue Sharks captured by Taiwanese longline fleets in the South Atlantic (black circles = mean [±2 SE] counts by reader 1 relative to reader 2; the number above each data point is the sample size).
![FIGURE 7. Age bias plot of vertebral band pair counts for Blue Sharks captured by Taiwanese longline fleets in the South Atlantic (black circles = mean [±2 SE] counts by reader 1 relative to reader 2; the number above each data point is the sample size).](/cms/asset/baede9d1-e3df-42e3-a750-4cc16160c7fa/umcf_a_1249579_f0007_b.gif)
TABLE 2. Comparison of von Bertalanffy growth function parameters for Blue Sharks examined in the present study and previous studies (L∞ = asymptotic length; k = Brody growth coefficient; t0 = theoretical age at zero length; tmax = maximum observed age).
FIGURE 8. Results of centrum edge analysis of vertebral centra from Blue Sharks captured by Taiwanese longline fleets in the eastern South Atlantic (black bars = translucent bands; open bars = opaque bands; the number above each bar is the combined-sexes sample size).
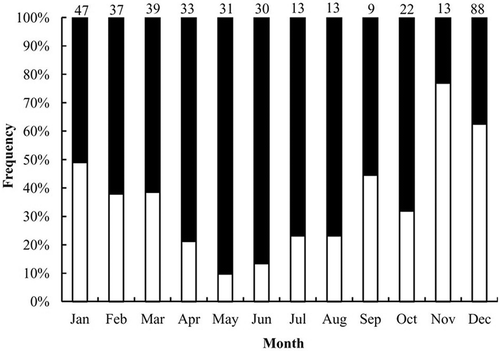
FIGURE 9. The von Bertalanffy growth function (VBGF) fitted to observed TL-at-age data for Blue Sharks captured by Taiwanese longline fleets in the eastern South Atlantic (open circles = males; open triangles = females; ×-symbols = individuals of unknown sex; solid line = VBGF for both sexes combined).
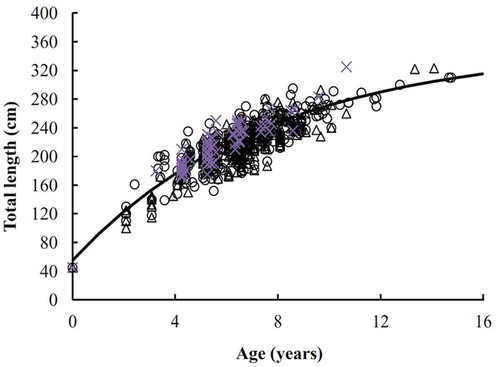
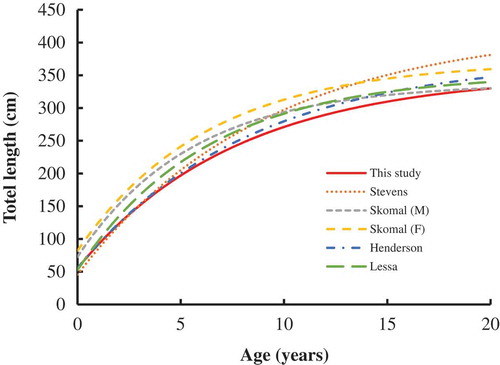
FIGURE 10. Comparison of growth curves (TL at age) for Blue Sharks (M = males; F = females) sampled in the Atlantic Ocean during the present study and in previous studies (Stevens Citation1975; Henderson et al. Citation2001; Skomal and Natanson Citation2003; Lessa et al. Citation2004).
