Figures & data
Figure 1. Study area map indicating the three tagging basins (outlined in dashed circles): San Juan Islands, Admiralty Inlet, and central Puget Sound. Tagging areas within basins (gray boxes), the receivers with detections (closed circles), and receivers without detections (x) are indicated.
Figure 2. The proportion of detections by resident Chinook Salmon at each receiver in the acoustic arrays at the Strait of Juan de Fuca (JDF) and Admiralty Inlet (ADM) relative to the local bathymetry. Each grey bar represents a matched receiver pair at the JDF dual parallel array (30 pairs) and a single receiver at the ADM one-line array (13 individuals). Receiver positions are aligned, by longitude, with the bathymetric profile (Ryan et al. Citation2009; http://www.marine-geo.org/tools/GMRTMapTool/) beneath each array. The bathymetric profiles include the location and depth of the receivers, approximately 5 m above the bottom, which correspond to the grey bar above. The dashed vertical line in the JDF panels marks the international boundary between the United States and Canada. The widths of the panels are proportional to the shore-to-shore distance along each array (JDF = 22.80 km, ADM = 5.36 km). The distance between receivers is 0.8 and 0.4 km at the JDF and ADM arrays, respectively.
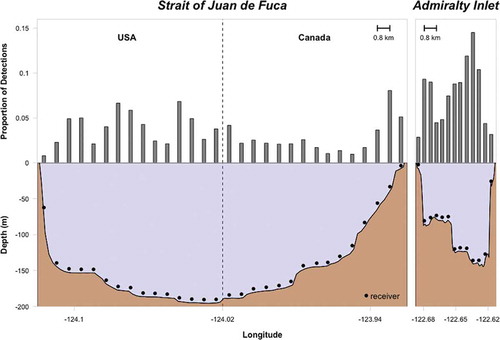
Figure 3. Dendrogram from hierarchical cluster analysis indicating four clusters of fish with similar basin fidelity, basin movement patterns, or both. The individual capital letters adjacent to the serial numbers indicate that fish were tagged in the SJI (S), ADM (A), and CPS (C).
Figure 4. Box plots of cluster variables (A) SJI duration, (B) SJI visits, (C) JDF duration, (D) JDF visits, (E) ADM duration, (F) ADM visits, (G) CPS duration, and (H) CPS visits by cluster group. The P-values are from Kruskal–Wallis tests for differences between clusters. Letters indicate significant differences between clusters from post hoc multiple comparison tests. Boxes with the same letter are not significantly different (i.e., a box labeled “a” is not significantly different than another labeled “a”). Boxes with different letters are significantly different (i.e., “a” is significantly different than “b”). Boxes with both letters are not significantly different from either (i.e., “ab” is not significantly different from “a” or “b”).
Table 1. Basin fidelity and interbasin movement data. The data for the eight variables (total duration in and number of visits to each basin) are provided for all 40 Chinook Salmon included in the cluster analysis.
Figure 5. Regional movement patterns by cluster group. Directional arrows are weighted by the number of movements (shown adjacent). Straight lines represent fish undergoing interregional movements, whereas U-shaped lines represent fish that were detected exclusively in their tagging region. In (D), the dashed line represents a fish that was detected in the CPS and then the JDF without being detected in the ADM, which means that it either departed the CPS via the Whidbey basin or via the ADM, where it avoided detection by the ADM array.