
Figures & data
Table 1. Cohort characteristics of the Copenhagen Infant Gut study (n = 25).
Figure 1. Alpha and beta diversity of the gut microbiota in the CIG cohort. (a–c) Heatmaps showing the alpha diversity measures Shannon index, Evenness index, and Observed ASVs, with gray color indicating missing samples. Statistical significance was evaluated based on repeated-measures correlations, with Rrm indicating the correlation coefficient between infant age and the indicated alpha diversity measure. (d,e) PCoA plots based on weighted Unifrac distances, colored by (d) sampling point and (e) subject ID. Statistical significance was evaluated based on PERMANOVA. Full color available online.
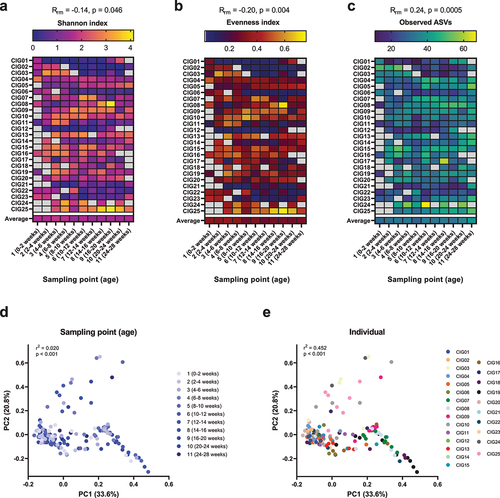
Figure 2. Longitudinal dynamics of short chain fatty acids in feces of infants in the CIG cohort. Statistical significance was evaluated based on repeated-measures correlations, with Rrm indicating the correlation coefficient between infant age and the indicated metabolite (ninfants = 25, ndatapoints = 144). Boxes and whiskers plot show median (black line), 25th–75th percentile (boxes) and 10th–90th percentile (whiskers).
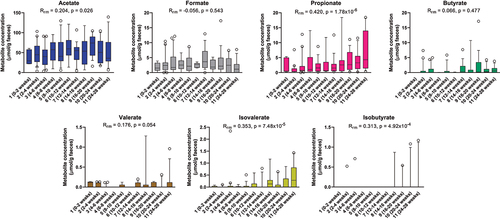
Figure 3. Longitudinal dynamics of AAAs and microbiota-derived catabolites in feces of infants in the CIG cohort. Statistical significance was evaluated based on repeated measures correlations, with Rrm indicating the correlation coefficient between infant age and the indicated metabolite concentration (ninfants = 25, ndatapoints = 267). Boxes and whiskers plot show median (black line), 25th–75th percentile (boxes) and 10th–90th percentile (whiskers). Plots of tryptophan, phenylalanine, and tyrosine metabolites are colored purple, green, and orange, respectively. Full color available online.
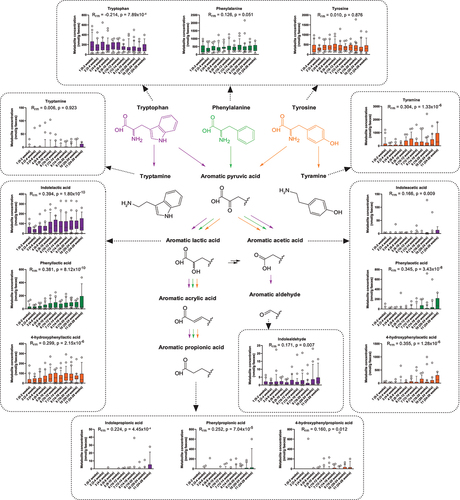
Figure 4. Bacterial taxa associate with the abundance of AAA catabolites in the CIG cohort. The heatmap shows hierarchical clustered repeated-measures correlation coefficients between the absolute abundance of the most abundant ASVs (average relative abundance > 0.05%) and the concentrations of the AAAs and their catabolites in feces from the CIG cohort. Cluster 1 contains the AAAs and tryptamine, whereas Cluster 2 contains the aromatic lactic acids, acetic acids, and propionic acids as well as indole aldehyde and tyramine. Statistical significance was evaluated by repeated-measures correlations with false discovery rate corrected p-values (q-values) shown by asterisks, * q < 0.05, ** q < 0.01, ***q < 0.001, and **** q < 0.0001. Bold face ASVs indicate taxa with significant association with the AAA catabolites that were selected for in vitro validation (see ). Unless otherwise noted, ASV taxonomies were based on the RDP database. Superscript annotations for taxa indicate that α; annotation of species-level taxonomy was obtained based on BLAST analysis of the given ASV sequence against the 16S rRNA database at NCBI, and β; annotation of species-level taxonomy was not possible, since the ASV sequence matched multiple species within the given genus based on BLAST analysis against the 16S rRNA database at NCBI (see Supplementary Table S2).
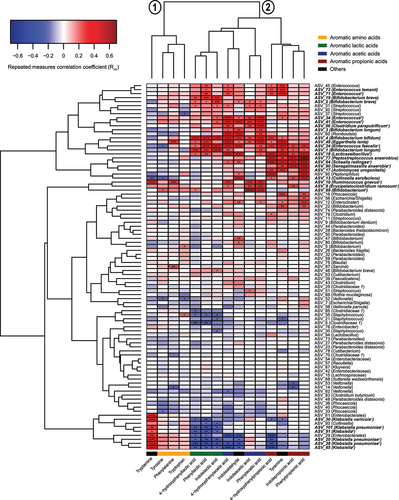
Figure 5. In vitro production of AAA catabolites by selected bacterial strains. Strains were cultured in BHI broth for 72 h at 37°C before assessing the amount of the AAA catabolites in the culture supernatants. Bold face text indicate the species where the main taxa–metabolite association from the CIG cohort was confirmed.
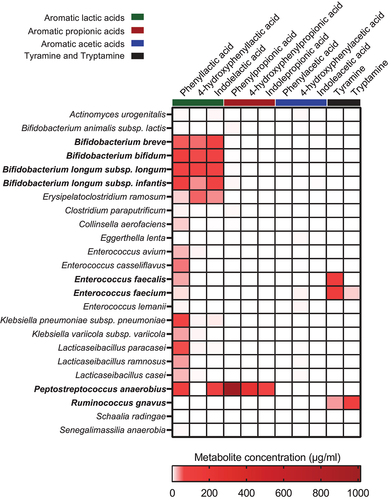
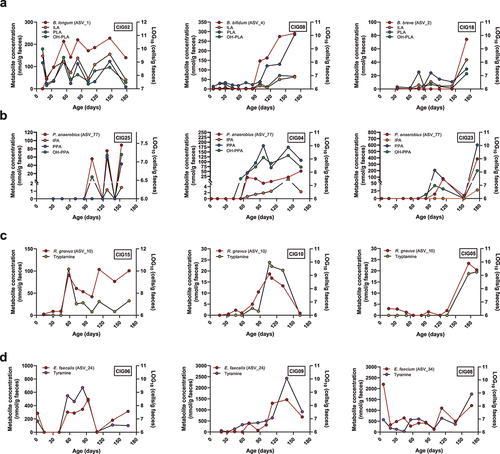
Figure 6. Intra-individual microbe–metabolite co-variation in feces of selected infants from the CIG cohort. (a) Examples of individuals showing co-variation between the abundance of aromatic lactic acids and B. longum, B. bifidum, or B. breve. (b) Examples of individuals showing co-variation between the abundance of the aromatic propionic acids and P. anaerobius. (c) Examples of individuals showing co-variation between the abundance of tryptamine and R. gnavus. (d) Examples of individuals showing co-variation between the abundance of tyramine and E. faecalis or E. faecium.
Supplemental Material
Download Zip (154.1 KB)Data Availability Statement
16S rRNA gene amplicon sequencing data has been deposited in the Sequence Read Archive (SRA) under BioProject PRJNA554596 (CIG).