
Figures & data
Figure 1. High-fat diet increased susceptibility to oral and systemic Listeria monocytogenes infection, but this increase was absent in mice treated with A. muciniphila.
Notes: Study timeline (a). Mice were fed a low-fat (LF) or high-fat (HF) diet throughout, while one group was fed a high-fat diet along with gavage with A. muciniphila (AHF, n = 30 mice per group). Ten mice from each group were sacrificed at day 13 to examine the physiological environment pre-infection, while remaining mice were infected with Listeria either by intragastric gavage (IG) or intraperitoneal (IP) injection before sacrifice on day 16. Listerial colony forming units (CFUs) in mice infected by IG were increased by high-fat diet in the mesenteric lymph nodes and liver, and this increase was absent in mice fed a high-fat diet alongside A. muciniphila gavage (b, ANOVA and KW-test followed by Tukey’s or FDR pairwise comparisons respectively). In mice infected by IP injection, listerial CFUs were increased by high-fat diet in the mesenteric lymph nodes, spleen, and liver, and this increase was also absent in mice fed a high-fat diet alongside A. muciniphila gavage (c, ANOVA and KW-test followed by Tukey’s or FDR pairwise comparisons respectively).
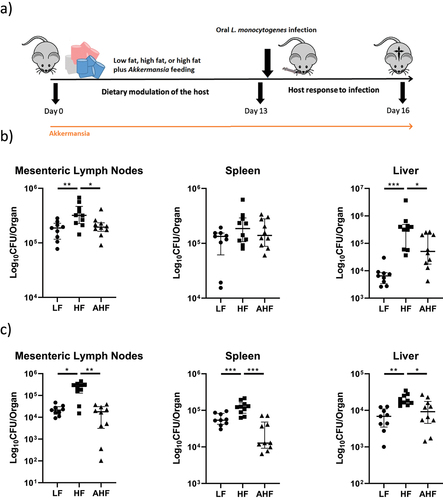
Figure 2. A. muciniphila reduces inflammatory expression and goblet cell numbers in the ileum while exacerbating hepatic immune expression.
Notes: Expression of inflammatory genes was measured by qPCR in the distal ileum and liver. This revealed a suppression of inflammatory expression in the ileum, but exacerbation of inflammation in the liver, by A. muciniphila at day 13 (a, ANOVA and KW-test followed by Tukey’s or FDR pairwise comparisons respectively, each solid-color rectangle represents one mouse). This was confirmed in the ileum by histological analysis (b, KW-test followed by FDR pairwise comparisons), which also revealed an increase in the number of ileal goblet cells induced by high-fat diet, which was again absent in mice treated with A. muciniphila (c, KW-test followed by FDR pairwise comparisons). Representative images of the H&E-stained ileum are presented (d). The arrows highlight the presence of polymorphonuclear cells in the top of the villi (black arrows) and in the bottom of the crypt (blue arrows). qPCR analysis at day 16 revealed a suppression of inflammatory signaling in the context of a high fat diet, while Ccl2 expression was increased by A. muciniphila, which also significantly increased Tnfα expression in the liver (e, ANOVA and KW-test followed by Tukey’s or FDR pairwise comparisons respectively, each solid-color rectangle represents one mouse).
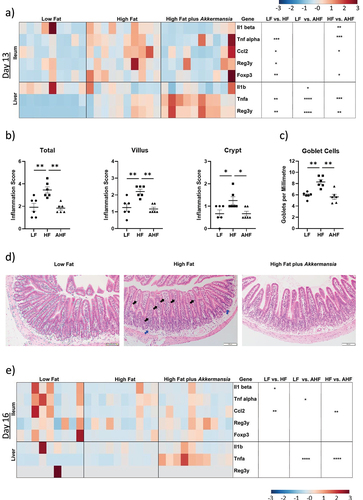
Figure 3. The protective effect of A. muciniphila does not appear to be driven by changes in the gut microbiota.
Notes: The gut microbiome was analyzed by 16S gene sequencing. While the alpha diversity decreased over time, there were no changes between groups at any one timepoint (a, ANOVA and KW-test followed by Tukey’s or FDR pairwise comparisons respectively). The beta diversities of all groups were significantly different from each other at day 13, but this difference had disappeared at day 16 (b, PERMANOVA of Bray-Curtis dissimilarity). Relative abundance of the Bacteroidetes phylum was decreased in both high fat and high fat plus A. muciniphila (AHF) groups at day 13 compared to low fat (LF), while Firmicutes was increased in AHF compared to LF at day 13, but these differences disappeared at day 16 (c, ANOVA and KW-test followed by Tukey’s or FDR pairwise comparisons respectively). Several taxa were significantly different between groups at day 13 (d, ANOVA and KW-test followed by Tukey’s or FDR pairwise comparisons respectively) and these changes appeared to be driven by diet rather than A. muciniphila, while there were no significantly different taxa at day 16.
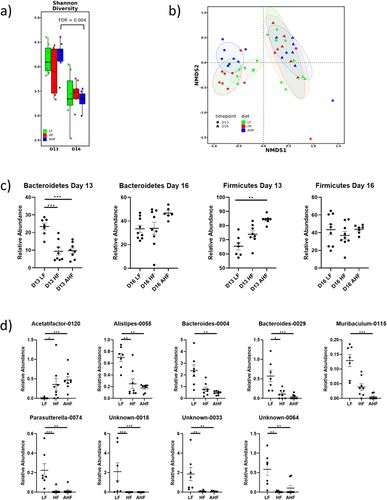
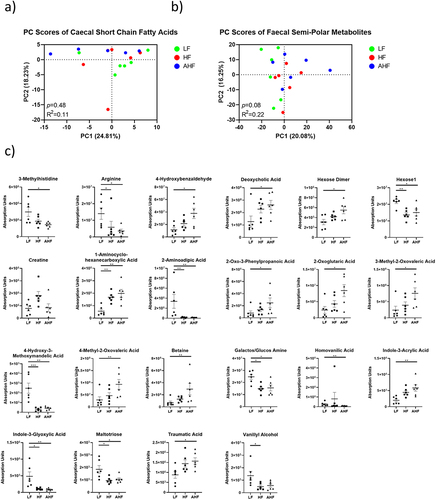
Figure 4. The protective effect of A. muciniphila does not appear to be driven by fecal or cecal metabolomes at day 13.
Notes: The production of microbial metabolites was examined by measuring short chain fatty acids in the cecum and semi-polar metabolites in the feces of each group by UPLC at day 13. Principal component analysis detected no changes between groups for cecal or fecal metabolites (a and b, Principal Component Analysis). Only the significantly different metabolites, identified at least to a level based on accurate mass and known retention time obtained from standards analyzed on the same system, are presented (c, ANOVA and KW-test followed by Tukey’s or FDR pairwise comparisons respectively).
Data availability statement
All data are available on Zenodo at the following link https://doi.org/10.5281/zenodo.7590374.