
Figures & data
Figure 1. Differential gut microbiota modulates susceptibility to APAP-induced hepatotoxicity.
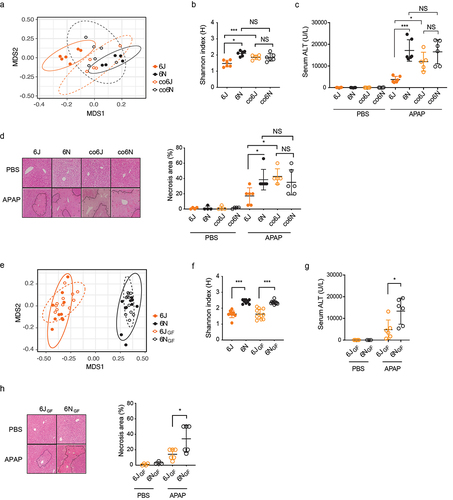
Figure 2. Identification of gut microbial metabolites potentially associated with differential susceptibility to APAP-induced hepatotoxicity using untargeted metabolomics.
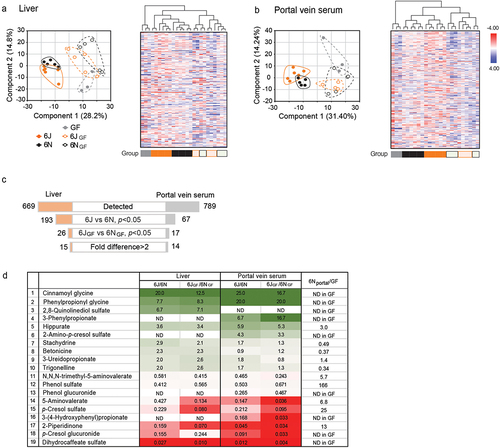
Figure 3. The gut bacterial metabolite, phenylpropionic acid (PPA), alleviates APAP hepatotoxicity.
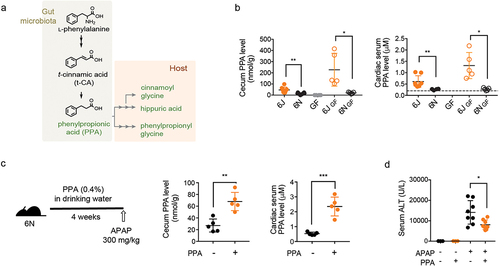
Figure 4. Phenylpropionic acid (PPA) alleviates APAP hepatotoxicity by lowering CYP2E1 levels.
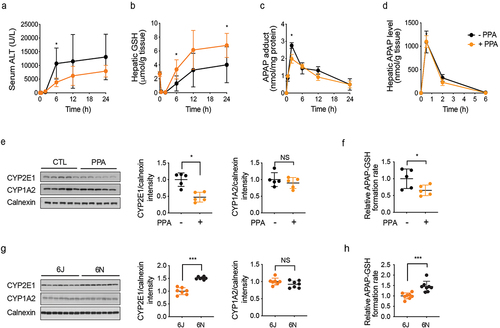
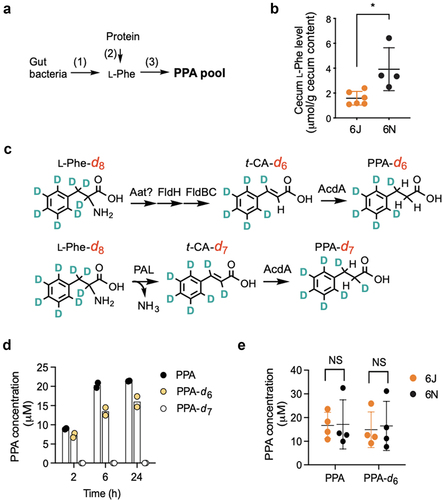
Figure 5. 6N cecal microbiota produces PPA as well as 6J cecal microbiota in vitro via a known l-Phe reductive pathway.
Supplemental Material
Download MS Word (1.6 MB)Supplemental Material
Download MS Word (16 KB)Supplemental Material
Download MS Excel (380 KB)Data availability statement
16S rRNA amplicon sequencing data have been deposited under the NCBI BioProjects (https://www.ncbi.nlm.nih.gov/bioproject/) PRJNA604264 (6J/6N cohousing and gut microbiota transplantation), PRJNA940413 (6J/6N cecal microbiota), and PRJNA604973 (PPA supplementation). Any additional information required to reanalyze the data reported in this study will be available upon request.