
Figures & data
Table 1. Clinical characteristics of infants and mothers included in the study.
Figure 1. Development of the gut microbiota with age in Chinese and Swedish cohorts. (a) Boxplot of gut microbial alpha diversity calculated by phylogenetic diversity metrics among the NB, 4 M, 12 M and mother groups. (b) Boxplot of gut microbial alpha diversity calculated by phylogenetic diversity metrics among the NB, 4 M, 12 M and mother groups in the Chinese cohort and Swedish cohort. (c) PCoA plot of the gut microbiota based on unweighted UniFrac distance among the NB, 4 M, 12 M and mother groups. The boxplots along each axis indicate the values of first and second principal coordinates, grouped by infant groups. The whisker plots indicate 95% confidence interval around medians. (d) Boxplot of unweighted UniFrac distance of gut microbiota among the NB, 4 M, 12 M and mother groups. (e-g) Discriminative bacteria of Chinese infants and Swedish infants in the NB (e), 4 M (f) and 12 M groups (g). (****p < 0.0001, ***p < 0.001, **p < 0.01, *p < 0.05).
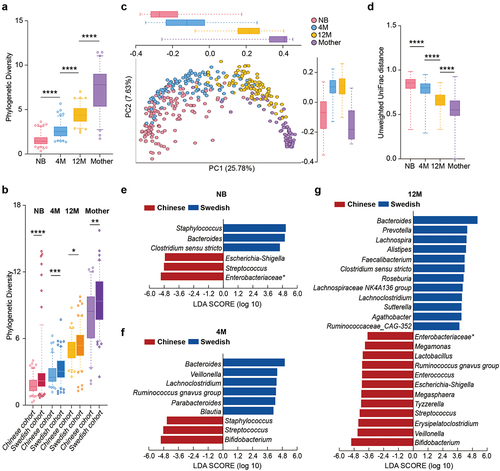
Figure 2. Development of the fecal metabolome with age in a Chinese cohort. (a) PLS-DA plot of the fecal metabolome in the NB, 4 M, 12 M and mother groups (R2Y = 0.385, Q2 = 0.35). The permutation test (999 times) indicates that the model is not overfitted (R2 = 0.037 Q2 = −0.076). (b) Bubble plot of the total relative content of each metabolic subclass with age. (c-d) Fold changes in lipids (c), and amino acids and peptides (d) in the NB, 4 M and 12 M groups. Fold changes were calculated as the ratio of the relative content of each metabolite between the younger age group and the older age group and converted logarithmically. Red indicates Log2 FC > 1.0 and FDR < 0.05, blue indicates Log2 FC < −1.0 and FDR < 0.05, and black indicates no significant difference. (****p < 0.0001, *** p < 0.001, ** p < 0.01, * p < 0.05).
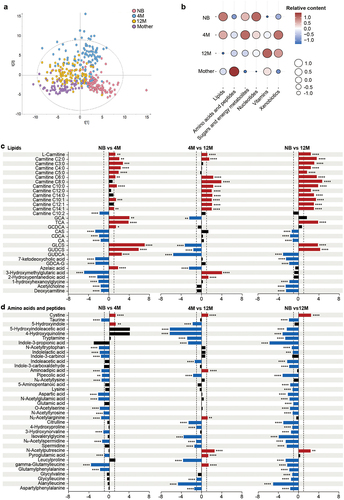
Figure 3. Networks of interactions between the gut microbiota and fecal metabolites in the NB group, 4 M group and 12 M group at the species level. (a) NB group, (b) 4 M group and (c) 12 M group. The size of the microbial node indicates the relative abundance of the bacteria.
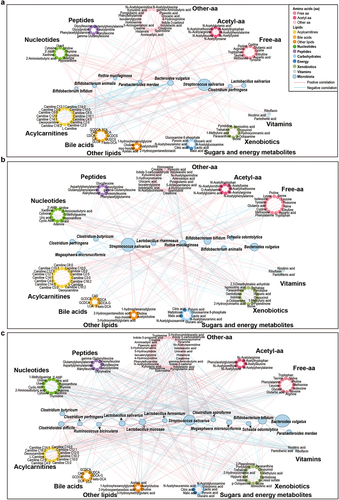
Figure 4. Effects of delivery mode and feeding on infant fecal metabolism and gut microbiota, and the association of short-chain acylcarnitines at birth with infant growth. (a) Heatmap of variation in fecal metabolites in the NB, 4 M and 12 M groups based on delivery mode. The ratio of the relative content of each metabolite between the different groups was calculated and converted logarithmically to make a heatmap. Asterisks (*) indicate metabolites with |Log2 FC| > 1.0 and FDR < 0.05. (b) Impact of feeding on the variations in acylcarnitines, bile acids and tryptophan metabolites with age in vaginal infants. (c) Heatmap of the Spearman correlation coefficients between acylcarnitines at birth and infant weight gain during the first year of life. Asterisks (*) indicate a significant correlation (p < 0.05). (d) Boxplots of the correlation between shorth-chain acylcarnitines and infant growth from birth to 12 months old (*p < 0.05). (e) Discriminative bacteria based on delivery mode in the Chinese and Swedish cohorts. (f) Discriminative bacteria based on levels of short-chain acylcarnitines. Data are represented as mean ± SEM. Short-chain acylcarnitines were tertiled based on the relative abundance, separately. T1 indicates the lowest tertile and T3 indicates the highest tertile (*p < 0.05 and LDA score above 2).
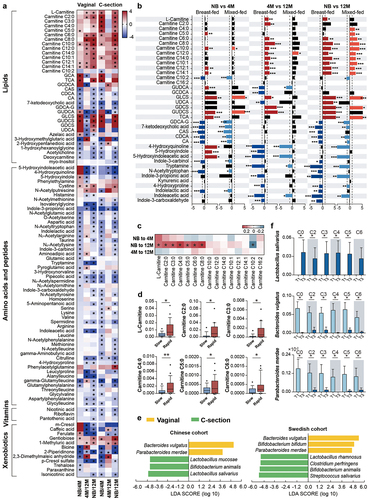
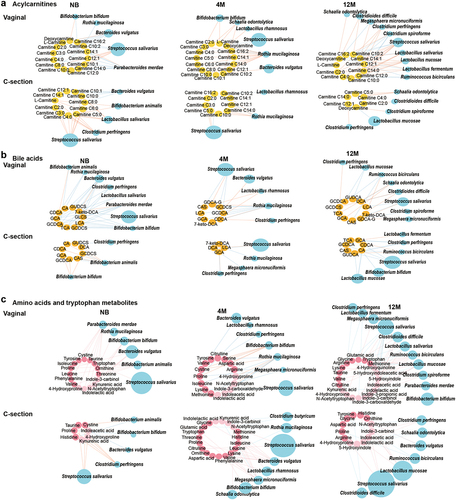
Figure 5. Maturation of the microbe-metabolome interaction in the NB, 4 M and 12 M groups based on delivery mode. (a) Acylcarnitines, (b) bile acids, (c) amino acids and tryptophan metabolites. Associations of other amino acids and derivatives with gut microbiota based on delivery mode are shown in Figure S6a. The size of the microbial node indicates the relative abundance of the bacteria.
Supplemental Material
Download Zip (3.5 MB)Data availability statement
The data for this study have been deposited in the European Nucleotide Archive (ENA) at EMBL-EBI under accession number PRJEB49858 (https://www.ebi.ac.uk/ena/browser/view/PRJEB49858), and the data for the Swedish cohort under PRJEB38986 (https://www.ebi.ac.uk/ena/browser/view/PRJEB38986). All data are available in the main text or the supplementary materials.