
Figures & data
Figure 1. Anti-α4β7-integrin therapy mitigates inflammation symptoms in remission-achieving colitis mice. (a) Daily variations in body weight and the weight ratio of Day 7/Day 0 (n = 9–11). (b) Daily variations in disease activity index (DAI) and DAI on Day 7 (n = 9–11). (c) Macroscopic observation of the colon and the colonic mucosa injury index (CMDI) (n = 9–11). (d) Hematoxylin and eosin (h&e) staining images and histological scores related to inflammation. Scale bar = 200 μm (n = 6). (e and f) Immunofluorescence images displaying CD3 and CD68 in situ expression. Scale bar = 50 μm (n = 4). (g) CD3 and CD68 mRNA expression levels (n = 6). (h) Inflammatory cytokine mRNA expression levels (n = 6). (i) Inflammatory cytokine levels in serum (n = 8). Mean ± SD is shown. One-way analysis of variance (ANOVA) was applied. nsp > .05, *p < .05, **p < .01, ***p < .001, and ****p < .0001.
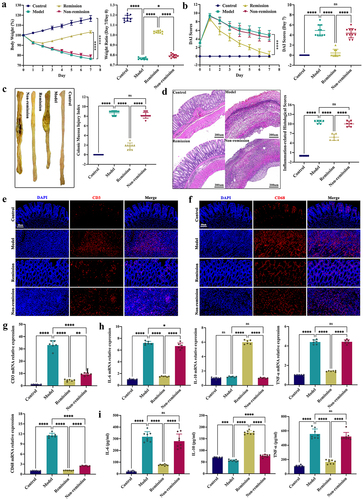
Figure 2. Anti-α4β7-integrin therapy repairs intestinal barrier damage in remission-achieving colitis mice. (a) Tight junctions mRNA expression levels (n = 6). (b and c) Immunofluorescence images displaying Zonula occludens-1 (ZO-1) and claudin-1 in situ expression. Scale bars = 100, 50, and 20 μm (n = 4). (d) Immunoblots showing ZO-1 and claudin-1 protein expression levels (n = 6). Mean ± SD is shown. One-way ANOVA was applied. nsp > .05, *p < .05, **p < .01, ***p < .001, and ****p < .0001.
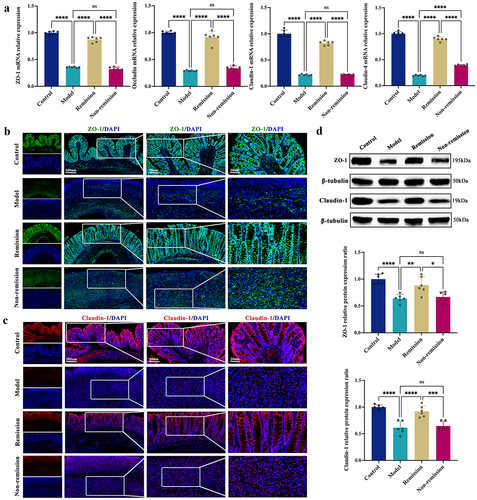
Figure 3. Baseline microbiome profiles can predict the treatment response. (a) PCA score plot. (b) NMDS plot. (c) ANOSIM analysis. (d-i) Fecal microbiota relative abundance at all levels. (j) Bacteria significantly varied at the genus level between groups with and without remission. (k) Bacteria significantly varied at the species level between groups with and without remission. (n = 3 in each group). The LEfSe algorithm was employed for performing differential abundance analyses using LDA coefficient cutoff values of 2.5 and FDR correction cutoff values of 0.05.
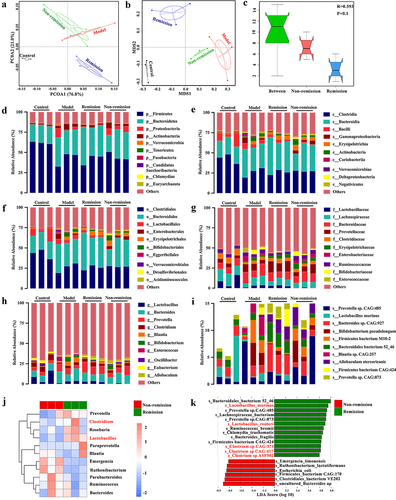
Figure 4. Gut microbiota depletion and fecal microbiota transplantation (FMT). (a) Schematic illustration of gut microbiota depletion caused by antibiotics (ABX). (b) Multiple sample PCoA. (c) Community α-diversity presented by the Chao 1, Shannon, and Simpson indices. (d) Schematic illustration of FMT to colitis mice. (e) Multiple sample PCoA in different groups. (f-i) Community α-diversity presented by the Chao 1, Shannon, and Simpson indices in different groups. (n = 4 in each group). Mean ± SD is shown. Student’s t test was applied. nsp > .05, *p < .05, and **p < .01.
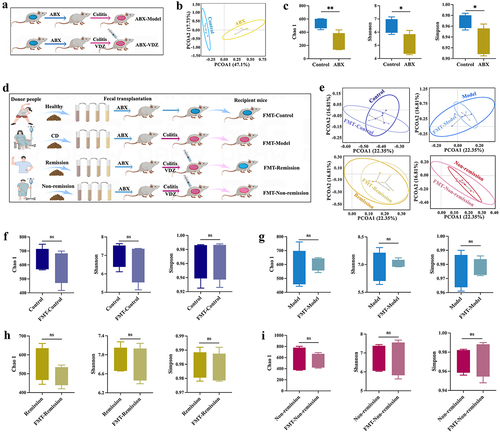
Figure 5. Baseline gut microbiota contain common bacteria with anti-inflammatory effects. (a and c) Daily variations in body weight and the weight ratio of Day 7/Day 0 (n = 10). (b and d) Daily variations in DAI and DAI on Day 7 (n = 10). (e and f) H&E staining images and histological scores related to inflammation. Scale bar = 200 μm (n = 6). Mean ± SD is shown. One-way ANOVA was applied. nsp > .05, **p < .01, and ****p < .0001.
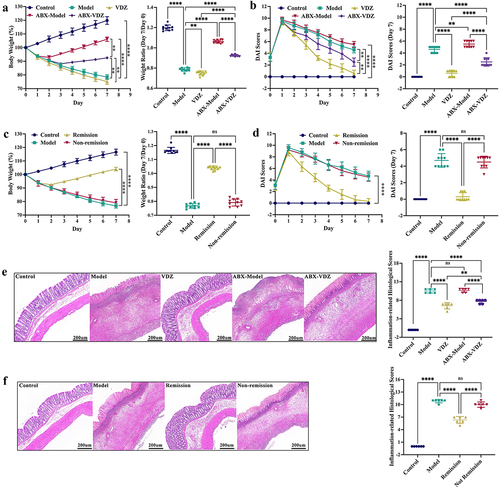
Figure 6. Baseline gut microbiota reduce mucosal barrier damage. (a and d) Tight junctions mRNA expression levels (n = 6). (b and e) Inflammatory cytokine levels in serum (n = 8). (c and f) Immunoblots showing ZO-1 and claudin-1 protein expression levels (n = 6). Mean ± SD is shown. One-way ANOVA was applied. nsp > .05, *p < .05, **p < .01, ***p < .001, and ****p < .0001.
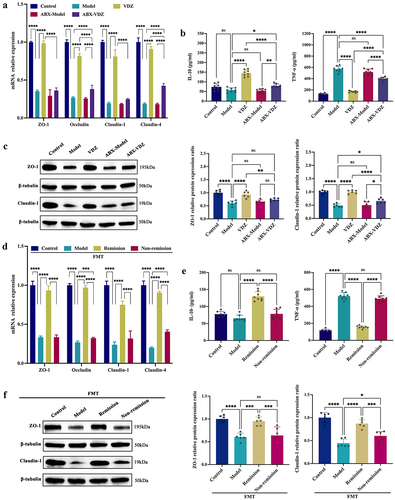
Figure 7. Baseline bile acid (BA) metabolism modulation is involved in the treatment response. (a) PCA score plot. (b) the level of secondary BAs and the ratio of secondary/primary BAs. (c) Composition of BAs. (d) Comparison of the relative diversity of significantly changed BAs across groups. (n = 6 in each group). Mean ± SD is shown. One-way ANOVA was applied. nsp > .05, *p < .05, **p < .01, ***p < .001, and ****p < .0001.
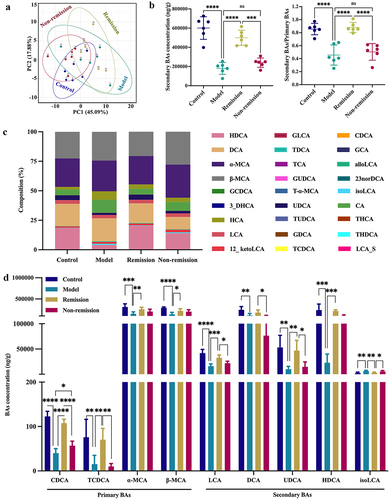
Figure 8. Ability to alter gut microbiota is essential for activating colonic FXR and TGR5. (a-c) FXR, TGR5, and downstream genes mRNA expression levels. (d – f) Immunoblots showing FXR and TGR5 protein expression levels. (n = 6 in each group). Mean ± SD is shown. One-way ANOVA was applied. nsp > .05, *p < .05, **p < .01, ***p < .001, and ****p < .0001.
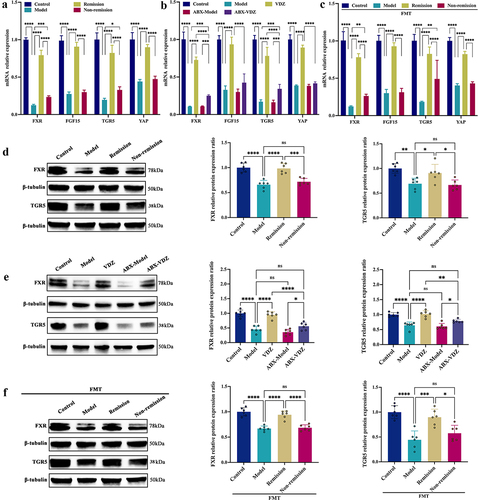
Figure 9. Production of microbial BAs has a direct stimulatory effect on FXR and TGR5. (a) FXR, TGR5, and downstream genes mRNA expression levels in Caco-2 cells. (b) Immunoblots showing FXR and TGR5 protein expression levels in Caco-2 cells. (n = 3 in each group). Mean ± SD is shown. One-way ANOVA was applied. **p < .01 and ***p < .001.
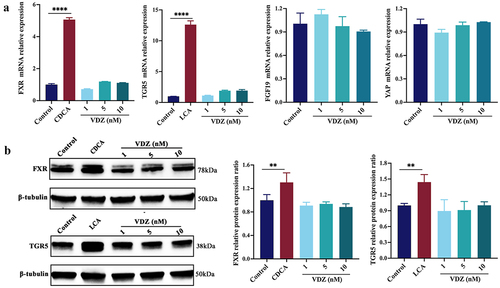
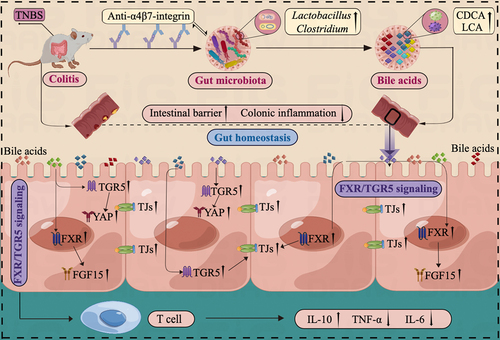
Figure 10. Illustration of the mechanism impacting the response to anti-α4β7-integrin therapy in humanized mice with colitis. The baseline gut microbiota in remission-achieving colitis mice contained common microbes that could regulate microbial BA levels. Moreover, the increased BA levels led to further stimulation of FXR and TGR5, which significantly improved gut barrier function and mitigated intestinal inflammation.
Supplemental Material
Download MS Word (14.7 KB)Supplemental Material
Download MS Word (17.5 KB)Supplemental Material
Download MS Word (22.5 KB)Data availability statement
The data generated during whole-genome shotgun metagenomic sequencing and 16S-rDNA gene high-throughput sequencing were deposited in the National Centre for Biotechnology Information (NCBI) Sequence Read Archive (SRA; https://www.ncbi.nlm.nih.gov/) under BioProject numbers PRJNA941025, PRJNA941019 and PRJNA941022.