
Figures & data
Figure 1. Colibactin exacerbates DSS-induced colitis.
(a) H&E staining of colon tissue from a control mouse, an SPF E. coli-free mouse, and an SPF mouse colonized with the pks+ M1/5 E. coli strain (scale bars: 50 µm). (b) Weight of the three groups shown in A (n = 6 mice per group). (c) Colonization levels with M1/5 E. coli over time (n = 9 mice). (d) Fluorescence in situ hybridization (FISH) for bacteria (general EUB338 probe, red) in sections of control mice showed no interaction between bacteria and the epithelium, as they were separated by a thick mucus layer (scale bar 50 µm). (e) Treatment schematic for infection of SPF E. coli-free mice with WT M1/5 E. coli or ΔclbR mutant. (f) Levels of M1/5 E. coli over time after DSS treatment (n = 9 mice). Colitis leads to an increase in the bacterial number, which remains stable during regeneration. (g) FISH for bacteria (general EUB338 probe, red) co-stained with E-cadherin (white) and Muc2 (green) in sections from mice treated with DSS for 5 d with DSS. The mucus layer is broken down, and bacteria can be found in close proximity to the epithelium (scale bar 50 µm). (h)Weight curves of uninfected mice (n = 8) and M1/5 E. coli-infected SPF mice (n = 13) during DSS treatment and recovery. (i)Weight curves of WT M1/5 E. coli-infected SPF mice (n = 5) and ΔclbR mutant-infected SPF mice (n = 4) during DSS treatment and regeneration *: p < 0.05, **: p < 0.01 calculated by Student’s t-test. All data are presented as mean ± SD.
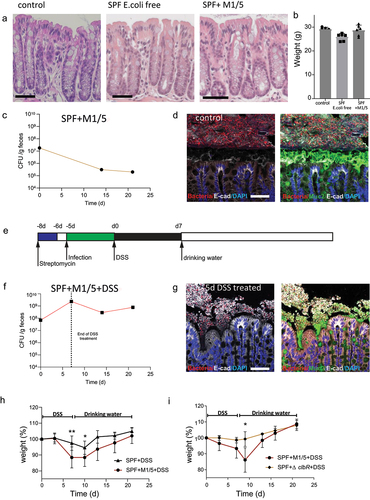
Figure 2. Colibactin increases the severity of tissue damage after DSS.
(a) Treatment schematic for infection of SPF mice with WT M1/5 E. coli or ΔclbR mutant. (b) Left: FISH for bacteria (general EUB338 probe, red) in colon sections from SPF mice infected with WT M1/5 E. coli or ΔclbR mutant (white line indicates epithelial lining, red line indicates border of intestinal microbiota in proximity to the epithelial surface). Right: E. coli colonization levels on day 7 of DSS treatment (WT, n = 3 mice; ΔclbR n = 4 mice). (c) H&E staining of colon sections from SPF mice infected with M1/5 E. coli or ΔclbR mutant. Red lines indicate injured tissue, green lines indicate epithelial lining that remains intact. Right: Quantification of the proportion of disrupted epithelium. (d) Colon crypt height of SPF mice infected with M1/5 E. coli or ΔclbR mutant (WT n = 3 mice, ΔclbR n = 4 mice). (e) Confocal microscopy images of colon tissue from SPF mice infected with M1/5 E. coli or the ΔclbR mutant on d 7 of DSS treatment stained for γH2AX (red) and DAPI, indicating more DNA damage (white arrows) in WT M1/5 E. coli-infected mice. Right: quantification of γH2AX-positive cells (WT, n = 3 mice; ΔclbR n = 4 mice). P-values were calculated using Student’s t-test. All data are presented as mean ± SD.
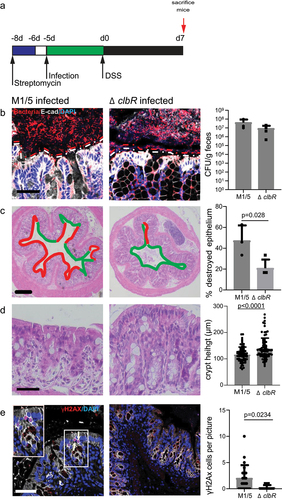
Figure 3. Colibactin delays tissue regeneration upon injury.
(a) Treatment schematic for infection of SPF mice with WT M1/5 E. coli or ΔclbR mutant. (b) FISH for bacteria (general EUB338 probe, red) in colon sections of SPF mice infected with WT M1/5 E. coli or the ΔclbR mutant (white line indicates epithelial lining, red line indicates border of intestinal microbiota in proximity to the epithelial surface). Right: quantification of the distance between the epithelium and the microbiota after 7 d (WT, n = 3 mice;, ΔclbR n = 3 mice) and 4 weeks (WT n = 3 mice, ΔclbR n = 3 mice). (c) H&E staining of the colon of SPF mice infected with WT M1/5 E. coli or ΔclbR mutant. Right: quantification of crypt height after 7 days (WT, n = 7 mice; ΔclbR n = 6 mice) and 4 weeks (WT n = 3 mice, ΔclbR n = 3 mice). (d) Confocal microscopy images of colon tissue from SPF mice infected with WT M1/5 E. coli or the ΔclbR mutant on day 7 of regeneration, stained for Ki67 (red), E-cadherin (white), and DAPI. Right: Quantification of Ki67-positive cells per crypt after 7 days (WT, n = 7 mice; ΔclbR n = 6 mice) and 4 weeks (WT, n = 3 mice; ΔclbR n = 3 mice). (e) Confocal microscopy images of colon tissue from SPF mice infected with WT M1/5 E. coli or the ΔclbR mutant on day 7 of regeneration stained for γH2AX (red, as shown by arrows) E-cadherin (white) and DAPI. Right: Quantification of γH2AX-positive cells per image. P-values were calculated using Student’s t-test. All data represent mean ± SD
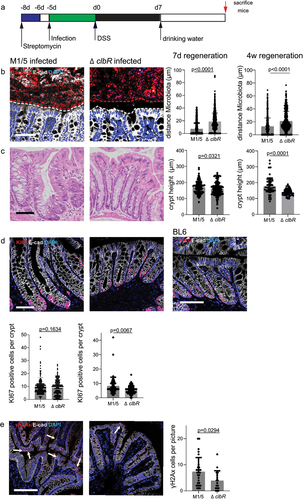
Figure 4. Infection with pks+ E. coli causes inflammation that resembles ulcerative colitis.
(a) Venn diagrams of genes upregulated (top) and downregulated (bottom) in human ulcerative colitis patients compared with genes upregulated or downregulated in mice infected with WT M1/5 E. coli vs. the ΔclbR mutant. GSEA showed an overlap between the regulated genes in human patients and WT M1/5 E. coli-infected mice. (b) Bar charts of fold-change of inflammatory genes upregulated in published transcriptome data from human ulcerative colitis patientsCitation12 (left) and mice infected with WT M1/5 E. coli (right), as assessed by microarray analysis. (c)Confocal microscopy images of colon tissue from SPF mice infected with WT M1/5 E. coli or the ΔclbR mutant after four weeks of regeneration stained for CD3 (green), IBA1 (green), and MPO (green) co-stained with DAPI (n = 3 mice per group).
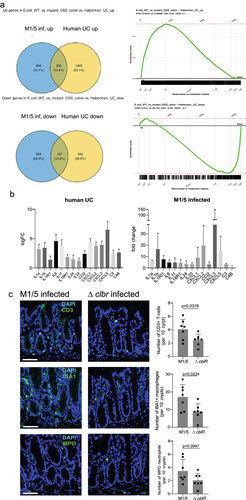
Figure 5. Epithelial changes seen in mice infected with WT M1/5 E. coli resemble those of human ulcerative colitis.
(a) Human colon tissue without colitis and during active ulcerative colitis stained with H&E (top) and imaged by confocal microscopy (bottom) stained with Ki67 (red), E-cadherin (white), and DAPI. (b) Fold-changes in epithelial genes regulated in human ulcerative colitisCitation12 and SPF mice infected with WT M1/5 E. coli as measured by microarray. (c) Microscopic images of single-molecule ISH for R-spondin 3 in human colon tissue without colitis and during active ulcerative colitis, as well as colon tissue from SPF mice infected with WT M1/5 E. coli or the ΔclbR mutant after 4 weeks of regeneration post-DSS. (d) Quantification of R-spondin 3 expression in human colon tissue without colitis and during active ulcerative colitis (data extracted from Habermann et al.) (e) qPCR for Rspo3, Lgr5, Aqp8 (WT n = 3 mice, ΔclbR n = 4 mice for all three genes), and Car4 (WT n = 3 mice, ΔclbR n = 3 mice) of RNA from SPF mice infected with WT M1/5 E. coli or the ΔclbR mutant after 1 month of regeneration after DSS treatment. P-values were calculated using Student’s t-test. Data represent mean ± SD
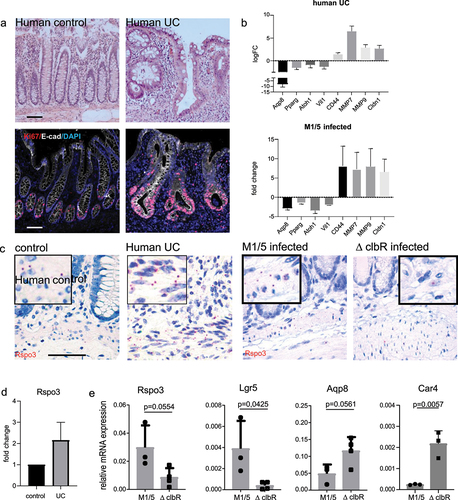
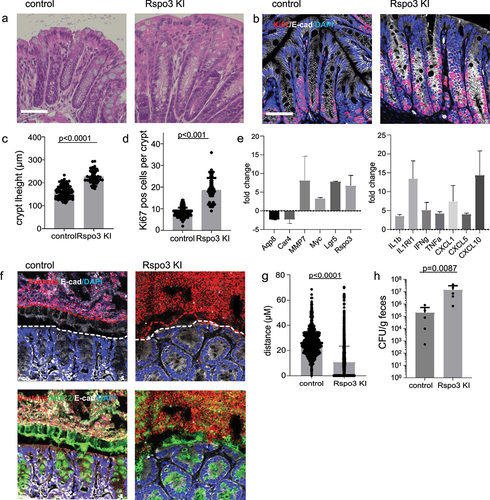
Figure 6. R-spondin 3 overexpression is sufficient to disrupt the mucosal barrier.
(a) H&E staining of colon tissue from control and Rspo3 KI mice 14 days after tamoxifen treatment (b) Confocal microscopy images of colon tissue from control and Rspo3 KI mice 14 days after tamoxifen treatment stained for Ki67 (red), E-cadherin (green), and DAPI. (c) Quantification of crypt length in colon tissue from control (n = 4) and Rspo3 KI (n = 4) mice 14 days after tamoxifen treatment. (d) Quantification of Ki67+ cells per crypt section in control (n = 4) and Rspo3 KI mice (n = 4) 14 days after tamoxifen treatment. (e) Fold-changes in regulated epithelial genes in Rspo3 KI mice compared to control mice as assessed by microarray. (f) Fluorescence in situ hybridization for bacteria (general EUB338 probe, red) in sections of control and Rspo3 KI mice 14 days after tamoxifen treatment (white line indicates epithelial lining, red line indicates the border of intestinal microbiota in proximity to the epithelial surface). (g) Quantification of the distance between the microbiota and epithelium in control and Rspo3 KI mice (n = 3 mice per group) (h) E. coli colonization levels in control and Rspo3 KI mice (mice with “conventional microbiota” were used and quantitative plating for E. coli in the stool performed). P-values were calculated using Student’s t-test. All data represent mean ± SD
Data availability statement
Microarray data have been deposited in the gene expression omnibus (GEO; https://www.ncbi.nlm.nih.gov/geo/) of the National Center for Biotechnology Information under accession number GSE205403, reviewer token: sxcrkgounnorlmd.