
Figures & data
Figure 1. C3G, PCA and PGA showed the protective effect against MAFLD in mice. (a) Growth curves of body weight. (b) Representative sections of liver by hematoxylin – eosin (H&E) staining (original magnification × 100). Levels of (c) ALT, (d) AST, (e) glucose and (f) HDL-c/LDL-c ratio in serum were measured using an automatic biochemical analyzer. Cytokines including (g) IL-1β, (H) IL-2, (I) IL-6, (J) TNF-α and (K) MCP-1 in serum were measured with their respective ELISA kit. Data represent as mean ± SD (n = 4), and bars with different letters differ significantly (P < 0.05). Hepatic histopathological scores were evaluated based on NAFLD Activity Score (NAS). The score ranging from 0 to 8 is defined as the unweighted sum of the scores for steatosis (0–3), lobular inflammation (0–3) and ballooning (0–2). ALT, alanine aminotransferase; AST, aspartate aminotransferase; C3G, cyanidin-3-glucoside; FA, ferulic acid; HDL-c, high density lipoprotein cholesterol; HFD, high-fat diet; IL, interleukin; LDL-c, low density lipoprotein cholesterol; LFD, low-fat diet; MCP-1, monocyte chemoattractant protein-1; PCA, protocatechuic acid; PGA, phloroglucinaldehyde; TNF-α, tumor necrosis factor-α; VA, vanillic acid.
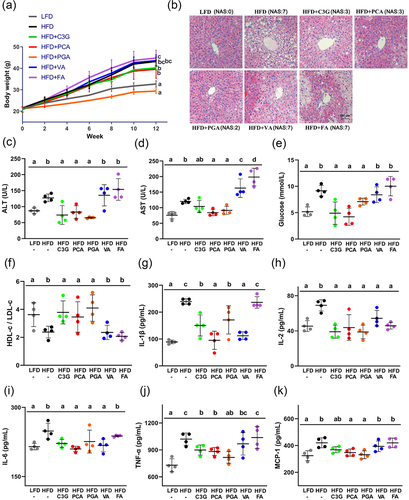
Figure 2. PCA showed a dose-dependent effect against MAFLD by attenuating insulin resistance in mice. (a) Growth curves of body weight. (b) Intraperitoneal fat weight. (c) Liver weight. (d) Representative sections of intraperitoneal fat by hematoxylin – eosin (H&E) staining with original magnification × 100 (left) and × 400 (right). (e) Representative liver sections by hematoxylin – eosin (H&E) staining with original magnification × 100 (left) and × 400 (right). (f) Representative liver sections by oil red staining (original magnification × 100). (G1) Serum level of AST. (G2) Serum level of ALT. (h) the content of MDA in liver. (i) the HDL-c/LDL-c ratio in serum. (j) Serum level of TNF. (K) HOMA-IR index based on serum levels of glucose and insulin. Data represent as mean ± SD (n = 6). Bars with different letters differ significantly (P < 0.05). Hepatic histopathological scores were evaluated based on NAFLD Activity Score (NAS). The score ranging from 0 to 8 is defined as the unweighted sum of the scores for steatosis (0–3), lobular inflammation (0–3) and ballooning (0–2). ALT, alanine aminotransferase; AST, aspartate aminotransferase; HDL-c, high density lipoprotein cholesterol; HFD, high-fat diet; HOMA-IR, homeostasis model assessment-estimated insulin resistance; LDL-c, low density lipoprotein cholesterol; LFD, low-fat diet; MDA, malondialdehyde; PCA, protocatechuic acid; TNF, tumor necrosis factor.
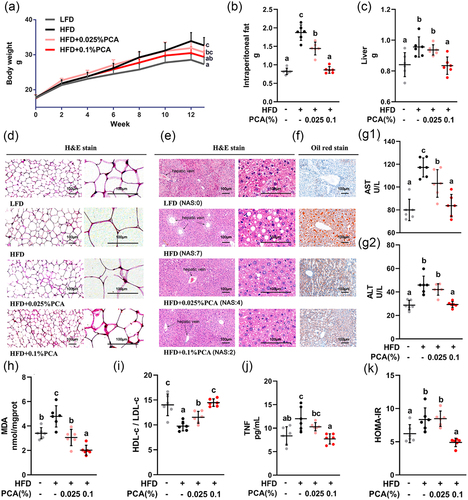
Figure 3. PCA alleviated MAFLD by inhibiting Enterococcus. (a) Ratio of Firmicutes to Bacteroidetes. (b) the relative abundance of Enterococcus. (c) Correlation of gut microbiota and serum indicators. (d) Correlation of gut microbiota and hepatic lipid metabolites. Feces were collected at the first day (Feces0W) and final day (Feces12W) of experiment, and cecal contents (Cecal contents12W) were collected after sacrifice. The intensity of the colors represented the degree of association (red, positive correlation; blue, negative correlation). Data represent as mean ± SD (n = 6), and significant correlations were marked by *P < 0.05, **P < 0.01. ALT, alanine aminotransferase; AST, aspartate aminotransferase; Cerm, ceramide; Glu, glucose; HDL-c, high density lipoprotein cholesterol; LDL-c, low density lipoprotein cholesterol; PS, phosphatidylserine; TG, triglyceride.
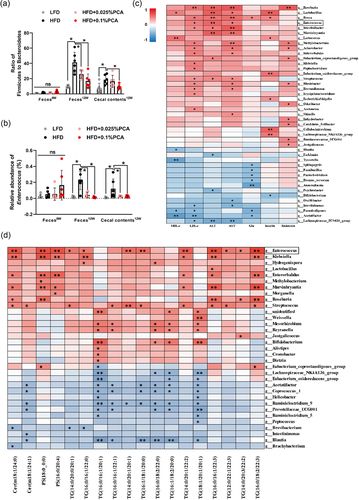
Figure 4. Effects of E. faecalis and PCA on MAFLD by FMT experiments. The first FMT experiment (A-K) aimed to investigate the effect of E. faecalis on MAFLD in mice (n = 6). (a) Body weight of mice. (b) Representative anatomical drawing. (c) Liver weight of mice. (f) Representative liver sections by hematoxylin – eosin (H&E) staining with original magnification × 100 (left) and × 400 (right). (e) TNF-α, (f) IL-1β, and (g) CPT1α in serum. (h) Representative CPT1α blots in liver. (i) NEFA, (j) TG, and (K) carnitine in 10% liver homogenate. The second FMT experiment (L-W) aimed to know the effect of PCA on E. faecalis associated MAFLD (n = 8). (l) Growth curves of mice body weight. (m) Intraperitoneal fat rate. (n) Liver weight. (o) HOMA-IR index based on serum levels of glucose and insulin. (p) Representative sections of intraperitoneal fat by hematoxylin-eosin (H&E) staining with original magnification × 100 (left) and × 400 (right). (q) Representative liver sections by hematoxylin-eosin (h and e) staining with original magnification × 100 (left) and × 400 (right). (r) Representative liver sections by oil red staining (original magnification × 100). (S) IL-1β and (t) CPT1α in serum. (u) Representative CPT1α blots in liver. (v) NEFA and (W) TG in 10% liver homogenate. Data represent as mean ± SD, and significant correlations were marked by *P < 0.05, **P < 0.01, ***P < 0.001, or bars with different letters differ significantly (P < 0.05). Hepatic histopathological scores were evaluated based on NAFLD Activity Score (NAS). The score ranging from 0 to 8 is defined as the unweighted sum of the scores for steatosis (0–3), lobular inflammation (0–3) and ballooning (0–2). CPT1α, carnitine palmitoyltransferase-1 alpha; E. faecalis, Enterococcus faecalis; FMT, fecal microbiota transplantation; HOMA-IR, homeostasis model assessment-estimated insulin resistance; LFD, low-fat diet; NEFA, non-esterified free fatty acids; PCA, protocatechuic acid; rE. faecalis, recipient mice of E. faecalis; rLFD, recipient mice of LFD; TG, triglyceride.
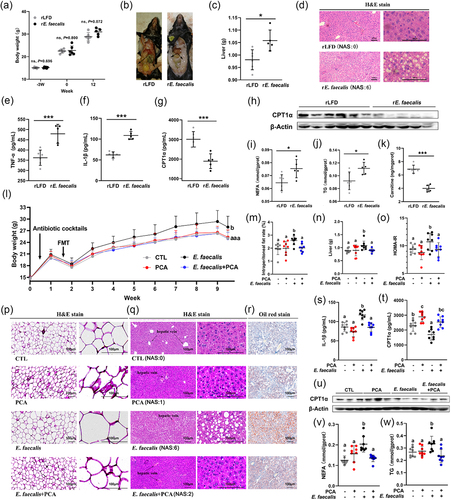
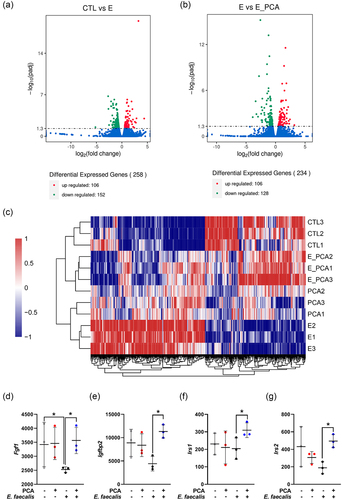
Figure 5. PCA ameliorated insulin resistance induced by E. faecalis in MAFLD mice. (a) Differential genes expressed between CTL and E. faecalis group. (b) Differential genes expressed between E. faecalis group and E. faecalis + PCA group. (c) Heatmap involving in CTL, PCA group, E. faecalis group and E. faecalis + PCA group. (d) Expression of Fgf1. (E) Expression of Igfbp2. (f) Expression of Irs1. (g) Expression of Irs2. Data represent as mean ± SD (n = 3), and significant correlations were marked by *P < 0.05. CTL, control group; E, E. faecalis group; E_PCA, E. faecalis + PCA group; Fgf1, fibroblast growth factor 1; Igfbp2, insulin-like growth factor binding protein 2; Irs1, insulin receptor substrate 1; Irs2, insulin receptor substrate 2; PCA, protocatechuic acid.
Supplemental Material
Download MS Word (6.7 MB)Data availability statement
The datasets presented in this study can be found in online repositories. The names of the repository/repositories and accession number(s) can be found below:
Sequencing of microbiota (Accession number: PRJNA764448): https://dataview.ncbi.nlm.nih.gov/object/PRJNA764067?reviewer=tqhu8ektn4cof3nv6u0t1g8a2f.
Nucleotide sequences of E. faecalis in bacteriostasis and FMT experiments: https://submit.ncbi.nlm.nih.gov/subs/?search=SUB10571133.