
Figures & data
Figure 1. Characterization of Con-Exo and Fn-Exo. (a) Con-Exo and Fn-Exo were extracted from the supernatants of PBS-treated FHC cells and Fn-infected FHC cells, respectively, by ultracentrifugation. (b) Representative TEM images of purified Con-Exo and Fn-Exo. Scale bar = 100 nm. (c) Nanoparticle tracking analysis of number and size distribution in Con-Exo and Fn-Exo. (d and e) Size (d) and concentration (e) of Con-Exo and Fn-Exo. (f) Western blotting analysis of exosomal markers CD63 and CD9 in Con-Exo and Fn-Exo, β-tubulin served as an internal control in whole-cell lysates. (g) Western blot analysis of Con-Exo and Fn-Exo proteins (CD63 and CD9) obtained from the same volume of FHC cells supernatants. Data are represented as means ± SEM. *p < 0.05, **p < 0.01.
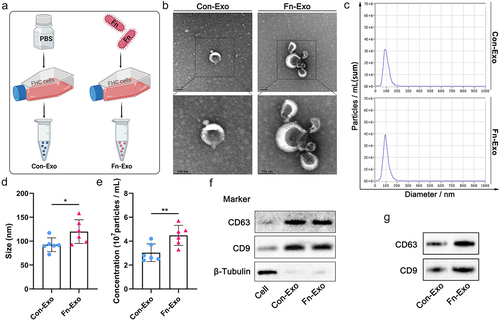
Figure 2. Fn-Exo exacerbates barrier damage and experimental colitis. (a) Internalization of Dil-stained exosomes (red) in Caco-2 cells was visualized using a confocal laser scanning microscopy. DAPI (blue) was used to stain nuclei. Scale bar = 10 μm. (b) TEER values of the Caco-2 monolayer cell model. (c) Fold change of FD4 flux in Caco-2 monolayer cells. (d) Western blotting was performed to assess the expression of TJ proteins (ZO-1 and Occludin) in FHC and Caco-2 cells. (e) Representative immunofluorescence images of ZO-1 (red) in Caco-2 monolayers treated with PBS, Con-Exo, or Fn-Exo. Nuclei were stained blue using DAPI (blue). Scale bar = 20 μm. (f) Representative morphology and length of mice colons. (g and h) Body weight loss (g) and disease activity indices (DAI) (h) of experimental colitis mice and blank control animals (n = 8). (i) Intestinal barrier dysfunction in mice was evaluated by measuring plasma FITC-dextran levels (n = 8). (j) Mean ± SEM of mouse colonic histological scores (n = 8). (k) Hematoxylin and eosin (H&E) staining of mouse colon cross-sections. Scale bar = 50 μm. (l) Immunoblot analysis was performed to assess the expression of ZO-1 and Occludin in mouse colon tissue. (m) Immunohistochemistry (IHC) staining of ZO-1 in colon sections of mice. Scale bar = 20 μm. Data are represented as means ± SEM. *p < 0.05, **p < 0.01, ***p < 0.001, ****p < 0.0001.
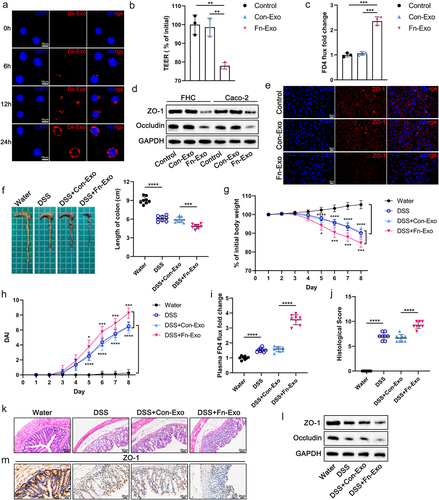
Figure 3. Exo-miR-129-2-3p may function as a potential Fn-high-UC diagnosis biomarker. (a) Venn diagram showing the unique and overlapping differential miRNAs between Con-Exo and Fn-Exo. (b) The up-and down-regulation of these 99 miRNAs. (c) Volcano plots of these 18 differentially expressed miRNAs. (d) Heatmap showing the profiles of differentially expressed miRNAs in Con-Exo and Fn-Exo. (e) Detection of relative expression levels of Exo-miR-129-2-3p in Con-Exo and Fn-Exo derived from 3 cell lines by qRT-PCR. (f and g) qRT-PCR analysis of Exo-miR-129-2-3p expression in serum of mice in different treatment groups (n = 6). (h) Relative Exo-miR-129-2-3p levels in healthy volunteers (n = 24) and UC patients (n = 72) serum. (i) The sensitivity and specificity of serum Exo-miR-129-2-3p for UC prediction were evaluated through receiver-operating characteristic (ROC) curve analysis. (j) qRT-PCR analysis of Exo-miR-129-2-3p expression in serum of healthy volunteers (n = 24), Fn-negative/low-UC patients (n = 30) and Fn-high-UC patients (n = 42). (k) ROC curve analysis assessed the sensitivity and specificity of serum Exo-miR-129-2-3p for the diagnosis of Fn-high-UC. Data are represented as means ± SEM. *p < 0.05, **p < 0.01, ***p < 0.001, ****p < 0.0001; NS, not significant.
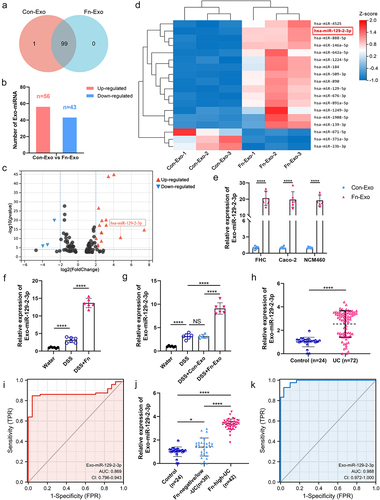
Figure 4. Exo-miR-129-2-3p facilitates barrier damage and DSS-induced colitis. (a and b) Quantitative analysis of TEER values (a) and FD4 flux (b) in Caco-2 monolayer cell models with different treatments. (c) Western blot analysis of TJ proteins (ZO-1 and Occludin) in Caco-2 cells. (d) Representative immunofluorescence photomicrographs of fluorescent localization and expression of ZO-1 (red) in Caco-2 cells. Nuclei were stained with DAPI (blue). Scale bar = 20 μm. (e) Representative photographs and quantitative analysis of mice colons in different treatment groups (n = 8). (f-i) Effect of Exo-miR-129-2-3p on the body weight (f), DAI (g), plasma FD4 fold change (h), and histological score (i) in DSS-induced colitis mice (n = 8). (j) H&E – stained images of colon cross-sections in mice after different treatments. Scale bar = 50 μm. (k) Expression of ZO-1 and Occludin in mouse colon tissue was detected by Western blotting. (l) Representative images of IHC staining of ZO-1. Scale bar = 20 μm. Data are represented as means ± SEM. *p < 0.05, **p < 0.01, ***p < 0.001, ****p < 0.0001.
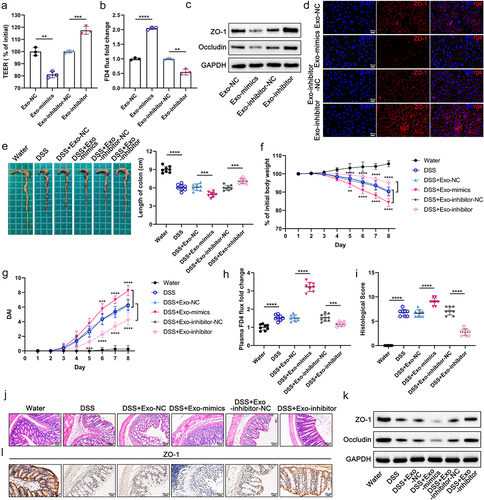
Figure 5. Identification of TIMELESS as a direct downstream target of miR-129-2-3p. (a) The up-and down-regulation of differential mRNAs between FHC cells transfected with NC and miR-129-2-3p-mimics. (b) Volcano plot of differentially expressed mRNAs. (c) Heatmap showing differentially expressed mRNAs between FHC cells transfected with NC and miR-129-2-3p-mimics. (d) RNA-seq, miRanda, RNAhybrid, and TargetScan were used to predict miR-129-2-3p target genes. (e and f) qRT-PCR (e) and Western blot analysis (f) of TIMELESS expression in FHC and Caco-2 cells transfected with miR-129-2-3p-mimics/NC or miR-129-2-3p-inhibitor/inhibitor-NC. (g) TIMELESS expression in colon tissues of healthy controls (n = 24) and UC patients (n = 72) was analyzed by qRT-PCR. (h) The ROC curve to evaluate the diagnostic value of TIMELESS for UC. (i) qRT-PCR analysis of TIMELESS expression in colon tissues of healthy volunteers (n = 24), Fn-negative/low-UC patients (n = 30), and Fn-high-UC patients (n = 42). (j) The diagnostic value of TIMELESS for Fn-high-UC was evaluated by the ROC curve. (k) Western blot analysis of TIMELESS protein levels in colon tissues of healthy volunteers (n = 4), Fn-negative/low-UC patients (n = 4), and Fn-high-UC patients (n = 4). (l) Upper panel: representative FISH images to assess the abundance of Fn in tissues from healthy controls, Fn-negative/low-UC patients, and Fn-high-UC patients. Lower panel: representative images of IHC staining analysis of TIMELESS expression. Scale bar = 20 μm. (m) The binding site of wild-type TIMELESS with miR-129-2-3p (AAGGGCU), and mutant sequence of TIMELESS 3ʹ-UTR (UUCCCGA). (n) Dual-luciferase assay was performed to investigate the direct binding between miR-129-2-3p and TIMELESS in FHC and Caco-2 cells. Data are represented as means ± SEM. **p < 0.01, ***p < 0.001, ****p < 0.0001; NS, not significant.
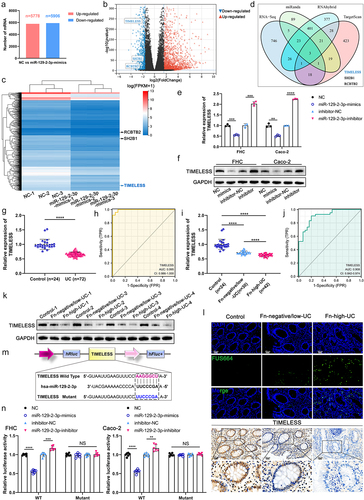
Figure 6. Fn-Exo promotes cellular senescence and DNA damage via the miR-129-2-3p/TIMELESS axis. (a) KEGG pathway enrichment analysis of TIMELESS. (b) Quantitative analysis and representative images of SA-β-Gal staining in FHC cells. Scale bar = 20 μm. (c) The protein levels of TIMELESS, p53, p21, p16, γH2AX, and H2AX were detected by Western blot in FHC cells transfected with NC, siTIMELESS, or siTIMELESS and miR-129-2-3p-inhibitor. (d) Representative immunofluorescent images showing the γH2AX foci (red) in FHC cells transfected with NC, siTIMELESS, or siTIMELESS and miR-129-2-3p-inhibitor. DAPI (blue) was used to visualize nuclei. Scale bar = 10 μm. (e) Representative micrographs showing Comet analysis. Scale bar = 50 μm. (f) Quantitative analysis and representative images of SA-β-Gal staining of FHC cells in different treatment groups. Scale bar = 20 μm. (g) Western blot analysis of TIMELESS, p53, p21, p16, γH2AX, and H2AX protein levels in FHC cells with different treatments. (h) Immunofluorescence staining was performed to analyze the protein levels of γH2AX (red) in FHC cells. DAPI (blue) was used to visualize nuclei. Scale bar = 10 μm. (i) Representative micrographs showing Comet assay in 5 different treatment groups. Scale bar = 50 μm. Data are represented as means ± SEM. **p < 0.01, ***p < 0.001, ****p < 0.0001.
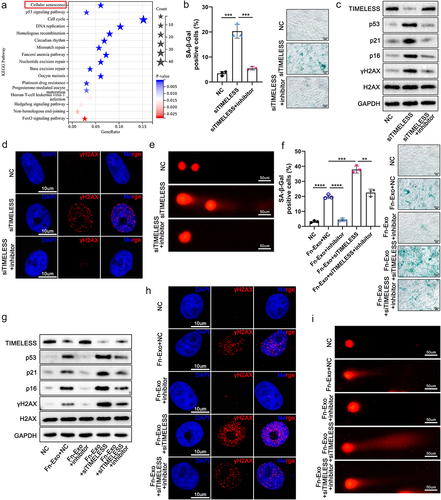
Figure 7. TIMELESS accelerates cellular senescence through the ATM/ATR/p53 pathway. (a) Protein-protein interaction networks for TIMELESS and 16 other genes involved in cellular senescence signaling pathways were constructed using the STRING online database and Cytoscape software. (b) Protein levels of TIMELESS, p-ATM, ATM, p-CHEK2, CHEK2, p-ATR, ATR, p-CHEK1, and CHEK1 in FHC cells transfected with NC or siTIMELESS were determined using western blotting assay. (c) Quantitative analysis and representative images of SA-β-Gal staining of FHC cells in 5 different treatment groups. Scale bar = 20 μm. (d) Western blot analysis of p-p53, p53, and p21 in FHC cells. The internal control was GAPDH. (e) Quantitative analysis and representative images of SA-β-Gal staining of FHC cells treated with NC and DMSO, siTIMELESS and DMSO, or siTIMELESS and Pifithrin-α. Scale bar = 20 μm. (f) Protein levels of p53 and p21 were evaluated by western blot analysis in FHC cells with different treatments. Data are represented as means ± SEM. **p < 0.01, ***p < 0.001, ****p < 0.0001.
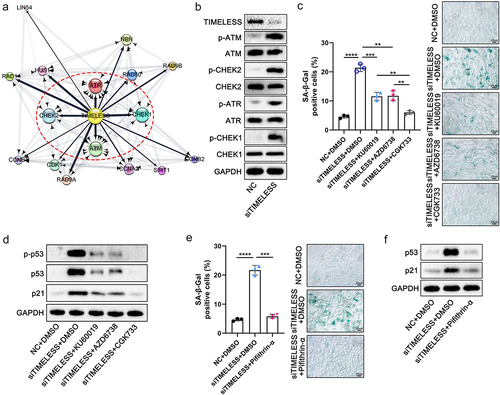
Figure 8. Fn-Exo exacerbates experimental colitis by activating the ATM/ATR/p53 pathway via the miR-129-2-3p/TIMELESS axis. (a-d) Representative morphology and length of colons (a), body weight loss (b), DAI (c), and histological score (d) of experimental colitis mice in 5 different treatment groups (n = 8). (e) H&E staining of mouse colon cross-sections after different treatments. Scale bar = 50 μm. (f) Representative images of IHC staining of ZO-1 in mouse colon cross-sections. Scale bar = 20 μm. (g) Immunoblot analysis was conducted to assess the expression of ZO-1 and Occludin using proteins extracted from colon tissues. GAPDH was used as an internal control. (h) Western blotting analysis of p53, p21, γH2AX, and H2AX in mice colon tissues. (i) SA-β-Gal staining of mouse colon cross-sections. Scale bar = 20 μm. (j-l) Representative immunofluorescence images showing the expression and distribution of p-ATM (red, j), p-ATR (red, k), and p-p53 (red, l) in mouse colonic epithelium. Nuclei were stained blue using DAPI. Scale bar = 20 μm. Data are represented as means ± SEM. **p < 0.01, ***p < 0.001, ****p < 0.0001.
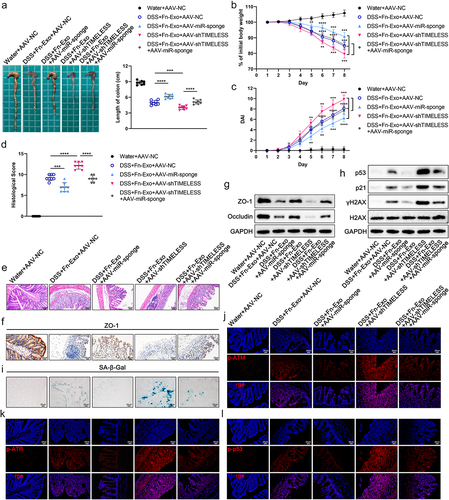
Figure 9. Inhibition of the ATM/ATR/p53 pathway alleviates the exacerbating effect of Fn-Exo on experimental colitis and cellular senescence. (a) Representative pictures of mouse colon morphology and statistical analysis of colonic length (n = 8). (b-d) Colitis severity in mice was evaluated by body weight loss (b), DAI (c), and histological score (d) (n = 8). (e) Representative images of H&E staining analyses. Scale bar = 50 μm. (f) Representative images of IHC staining of ZO-1 in mouse colon cross-sections. Scale bar = 20 μm. (g and h) Western blot assay was performed to measure the protein levels of ZO-1(g), Occludin (g), p53(h), and p21 (h) in colon tissues. GAPDH was used as an internal control. Groups are identified as shown. (i and j) The expression of p53 (i) and p21 (j) in colon cross-sections of mice was detected by fluorescence microscopy. Scale bar = 20 μm. (k) CGK733 and Pifithrin-α reduced the accumulation of SA-β-Gal in colon cross-sections of DSS- and Fn-Exo-treated mice. Scale bar = 20 μm. Data are represented as means ± SEM. *p < 0.05, **p < 0.01, ***p < 0.001, ****p < 0.0001.
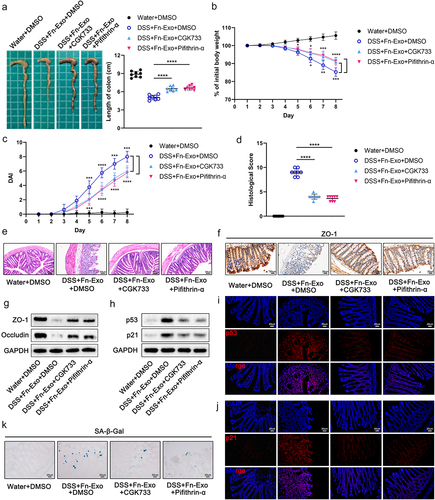
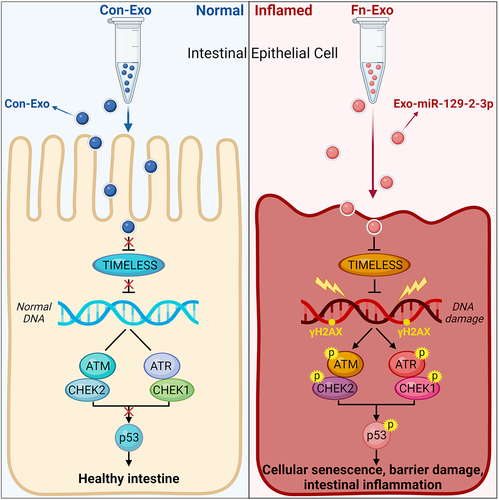
Figure 10. Schematic of the function and mechanism of Fn-Exo in UC. Fn-Exo promotes cellular senescence and barrier damage by activating the ATM/ATR/p53 pathway via the miR-129-2-3p/TIMELESS axis, thus accelerating the progression of colitis.
Supplemental Material
Download MS Word (1.2 MB)Data availability statement
All data generated or analyzed during this study are included in this published article and its supplementary information files. All sequencing data associated with this study have been uploaded to the NCBI (Sequence Read Archive) SRA database under the accession number PRJNA1000304 and PRJNA1000534.