Figures & data
Figure 1. Flowchart of the study design. The three cohorts are independent. From each cohort, we included the subset of individuals who had short-chain fatty acids (SCFA) measured. TwinsUK and ZOE PREDICT-1 cohorts consist of healthy individuals, while the acute trauma case-control includes fracture patients and healthy individuals.
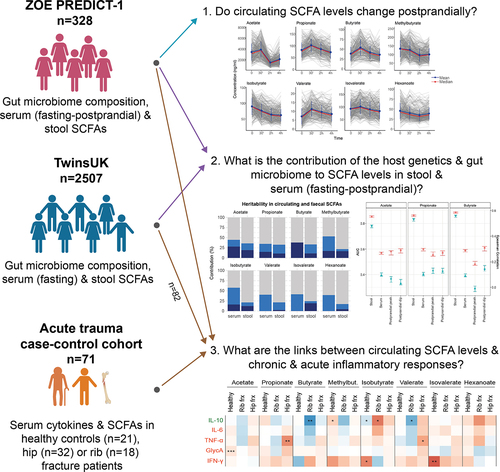
Table 1. Demographic characteristics and SCFA levels of the study populations TwinsUK and ZOE PREDICT-1.
Figure 2. (a) Fasting circulating and faecal SCFAs correlation in TwinsUK (n=2229) and ZOE PREDICT-1 (n=328). Spearman’s correlations are presented. Non-significant correlations (FDR≥0.05) are indicated with a ‘X’. (b) Postprandial changes in circulating SCFA levels for 328 ZOE PREDICT-1 participants in response to a meal challenge under a controlled clinic setting at baseline and after 30 min, 2h and 4h. The bars indicate the standard deviations for each time point.
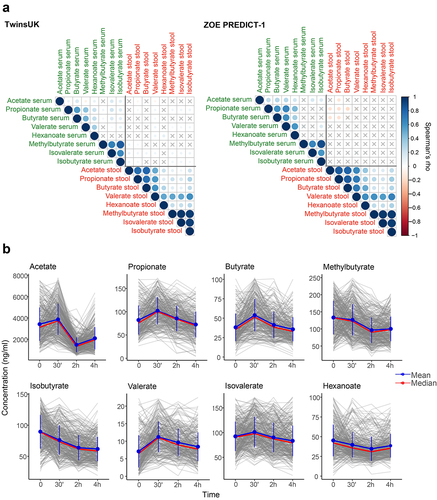
Figure 3. Contribution of host genetics and gut microbiome composition to SCFA levels in serum and stool. Analyses using serum at fasting and stool measurements were performed using the TwinsUK and ZOE PREDICT-1 participants together, while analyses using postprandial measurements were run using ZOE PREDICT-1 participants. Postprandial measures were defined as peak (the maximum SCFA concentration in the 4 hours following the test meal challenge minus the fasting level) and dip (the fasting level minus the minimum SCFA concentration in the 4 hours following the test meal challenge) (a) Heritability estimates of (left) fasting circulating and fecal SCFAs, and (right) postprandial circulating SCFAs. A, C and E labeling indicates the amount of variance attributed to the additive genetic factors or heritability, common/shared environmental factors, and unique environmental factors/error, respectively. (b) Influence of the gut microbiota composition in fecal and circulating (fasting and postprandial) SCFA levels estimated by Random Forest regression (using Spearman’s correlations) and classification (using AUC) models. Blue bars indicate the median and the 95% confidence intervals of the correlation between the real value of each component and the value predicted by regression models across 100 training/testing folds. Red bars represent the median AUC and the 95% confidence intervals across 100 folds for a corresponding binary classifier between the highest and lowest quartile.
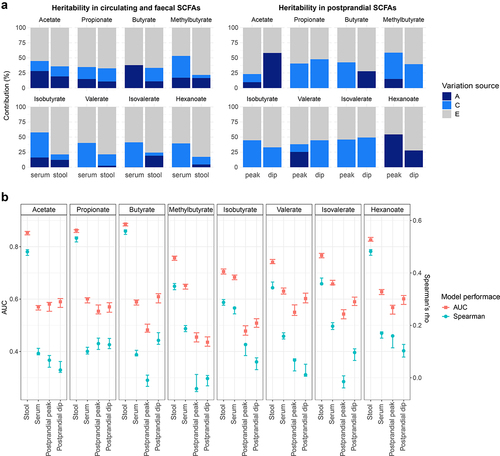
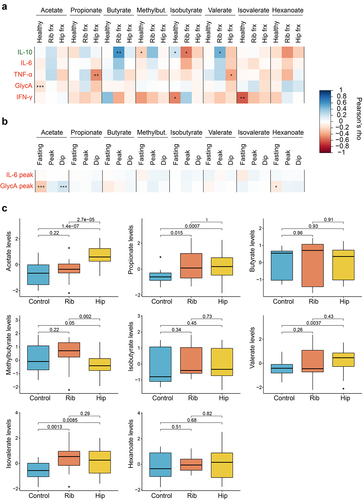
Figure 4. Role of circulating SCFAs in chronic and acute inflammation. (a) Pearson’s correlations between SCFA levels and anti- (IL-10) and pro-inflammatory (IL-6, TNF-α, GlycA,IFN-γ) markers stratified by healthy individuals and acute trauma cases. For the healthy group, correlation results obtained in the healthy individuals from the acute trauma case-control cohort, in the subset from TwinsUK and ZOE PREDICT-1 were combined by applying inverse variance random effect meta-analysis. Cases are from the acute trauma case-control cohort. The controls illustrate the links between SCFAs and chronic inflammation, whereas the cases show the links between SCFAs and acute inflammatory responses. (b) Pearson’s correlations between fasting and postprandial SCFA levels and the postprandial pro-inflammatory markers available in ZOE PREDICT-1 (IL-6 and GlycA). (c) Differences in the SCFA levels between controls and cases in the acute trauma case-control cohort. The p-values obtained from t-tests between groups are indicated. For these analyses, only individuals with both serum SCFAs and cytokines are included (i.e., TwinsUK, n=82; ZOE PREDICT-1, n= 328; acute trauma case-control cohort: controls, n= 21, rib fracture, n= 18, hip fracture, n=32). Levels were log-transformed and Z-scaled. P-value: *0.05; **0.01; ***0.001. Pro- and anti-inflammatory cytokines are colour-coded in red and green, respectively. Abbreviations: Frx: Fracture; IFN, interferon; IL, interleukin; Methylbut., methylbutyrate; TNF, tumour necrosis factor.