
Figures & data
Figure 1. Altered gut microbiome of COVID-19 patients is associated with disease severity. a. Distribution of disease severity categories across eight shotgun metagenome cohorts (inner circle) and twenty-three 16S rRNA gene amplicon sequencing cohorts (outer circle). Non-metric multidimensional scaling (NMDS) of microbiome-severity correlation based on species-level bray-curtis dissimilarity of B pooled shotgun metagenomes (n = 718) and C pooled 16S rRNA gene amplicon sequencing samples (n = 1,698) with known disease severity (See Extended Data Fig. S1a,b for the same analysis but including uncategorized COVID-19 samples, and Extended Data Fig. S2 and Fig. S3 for individual cohorts, respectively); colored boxplots on the top and the right represent Bray-Curtis dissimilarity by disease severity in the first and second ordinations respectively. d. COVID disease severity is significantly associated with differences in the microbiome i.e. taxonomy and function (KO, EC, pathway, and CAZyme) across cohorts (first stool sample only from each subject); taxonomy analysis is based on Bray-Curtis dissimilarity matrices computed on relative abundance, and Aitchison dissimilarity matrices computed on centered log-ratio (CLR) transformed absolute abundance with covariate adjusted and marginal sums of squares applied where appropriate. Global distribution of microbial dysbiosis scores as a measure of disease activity based on e shotgun metagenomes with known disease severity and f. 16S rRNA gene amplicon sequencing samples with known disease severity (See Extended Data Fig. S4a,b for the this analysis including uncategorized COVID-19 samples). g. Microbiome dysbiosis proportion is positively related to disease severity (linear model; data underlying this plot can be found at Extended Data Fig. S4a,b).
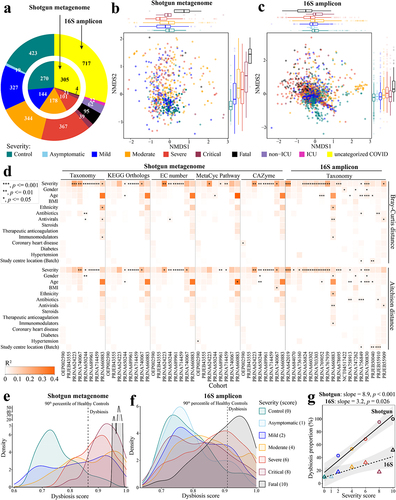
Figure 2. Longitudinal analysis reveals that the gut microbiome in patients with COVID-19 shifts back toward a state more similar to healthy controls over time. Within-subject Bray-Curtis dissimilarity of gut microbiome in COVID-19 individuals from (a) pooled shotgun metagenomes (n = 310 samples from 165 patients) and (b) pooled 16S amplicon samples (n = 594 samples from 387 patients) over time; colored lines (accompanying slope and p-value) represent linear fit to each disease severity: lm(within-subject Bray-Curtis dissimilarities ~ log(Day, 2), the green shaded area represents the 95% confidence interval of pooled COVID samples); colored boxplots on the right represent within-subject Bray-Curtis dissimilarity by disease severity; green violin plot on the right represents Within-subject Bray-Curtis dissimilarity of all COVID samples. Non-metric multidimensional scaling (NMDS) based on species-level Bray-Curtis dissimilarity matrices from (c) pooled shotgun metagenomes (n = 753) and (d) pooled 16S rRNA gene amplicon sequencing samples (n = 1,302) with known sampling day; contour plot was generated using the geom_density_2d function in ggplot2 R package, with contour lines colored by day on a log2 scale (see Extended Data Fig. S7 for plots c and d without contour lines). Gut microbiome tended to shift back toward a state that was more similar to healthy controls over time in two representative cohorts (e) PRJNA714459 (shotgun metagenome) and (f) PRJNA703303 (16S amplicon), see Table S3a for microbiome variations of COVID-19 patients at month 0, month 3, month 6, and month 9 to healthy controls (Bray-Curtis dissimilarity, permutations = 999); colored boxplots on the top and on the right represent Bray-Curtis dissimilarity over time in the first and second ordinations respectively. The prevalence of gut microbiome dysbiosis decreases over time from month 0 to month 6 in two representative cohorts (g) PRJNA714459 and (h) PRJNA703303; colored boxplots on the top represent dysbiosis score over time. Temporal shifts in dysbiosis score (median Bray-Curtis dissimilarity of a COVID sample to every healthy control, Methods) of the gut microbiome of COVID-19 patients based on (i) pooled shotgun metagenomes and (j) pooled 16S amplicon samples; blue lines represent loess fit to each disease severity.
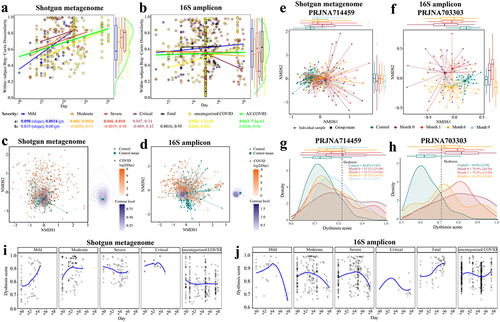
Figure 3. Reproducible microbial species linked to disease severity of COVID-19 across (a) shotgun metagenomic and (b) 16S amplicon cohorts. the color gradient indicates linear regression coefficient of severity (i.e., severity score and/or negative IgM and IgG) for each cohort (computed on relative abundance of first stool sample only from each subject with covariates adjusted); white indicates not detected in the cohort; ^ indicates false discovery rate (FDR) adjusted p < .1; * indicates p < .05; species names in bold indicate overlapping biomarkers between shotgun metagenomic and 16S amplicon data.
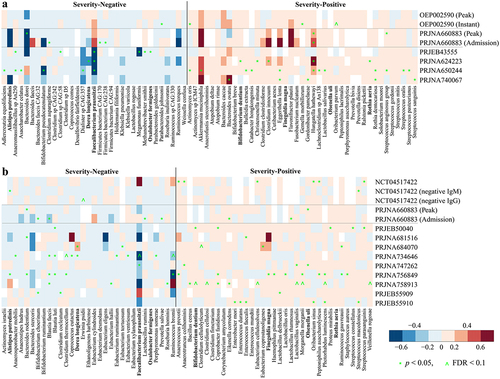
Figure 4. Microbiome signature taxa predict disease severity category of COVID-19 across cohorts. Predicted severity score from random forest (RF) regression model trained on (a) 74 metagenomic biomarkers, (b) all metagenomic species, (c) 66 16S biomarkers, and (d) all 16S species is associated with observed severity score. The mean relative abundance of Actinomyces oris (a severity-positive metagenomic biomarker) in the gut of healthy controls was positively associated with mortality rate of COVID-19 across 29 countries that reported at least 1,000 confirmed SARS-CoV-2 cases per country (e) during periods 1–3 and (f) each period. The abundance of gut metagenomic data of healthy controls were obtained from ExperimentHubCitation51 and mortality before COVID-19 vaccine administration in each country was obtained from JHU CSSE COVID-19 Dataset (please see Methods for details). r and p in red indicate Pearson’s correlation coefficient and p value; label on plot c indicates country. Solid lines show results from simple linear regression (lm function in R), with 95% confidence intervals shown in the shaded areas. The white circle represents the median of predicted severity score; the black bar in the center represents the interquartile range of predicted severity score; the light blue violin plot represents the kernel density of predicted severity score.
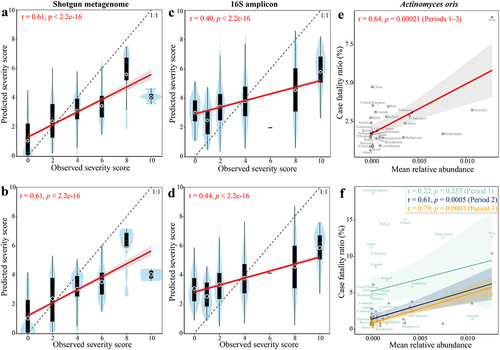
Figure 5. Associations between dietary intake (assessed through food frequency questionnaires and parsed by the NU-AGE food classification system) and gut microbiome biomarkers. Detected (a) shotgun metagenomic and (b) 16S amplicon biomarkers in the healthy individuals of published datasets (see Methods). Cluster (c) was generated with heatmap.2 function using a complete agglomeration method based on Euclidean distance. The color gradient indicates Spearman’s correlation coefficient (ρ) for each cohort; * indicates FDR adjusted p < .1.
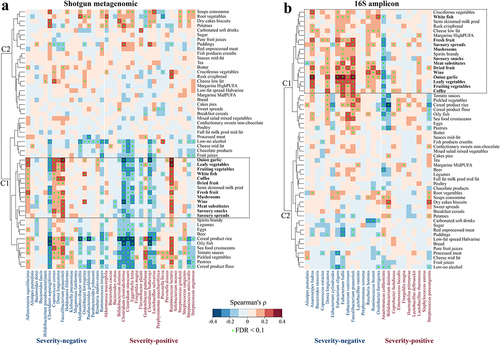
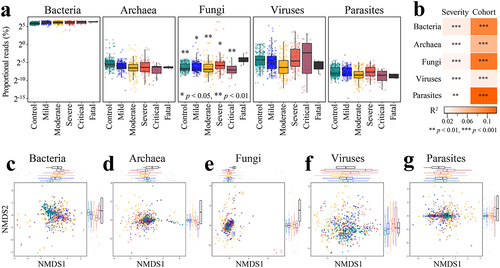
Figure 6. Altered proportions of gut bacterial, archaeal, fungal, viral, and parasitic communities in COVID patients are associated with disease severity. A. Distribution of proportional read (log2 scale) representation of five different microbial kingdoms in the shotgun metagenomes as a function of known disease severity (n = 718); *p < .05, **p < .01 (Fatal versus other disease category, Wilcoxon rank-sum test). B. COVID disease severity is significantly associated with differences in the bacterial, archaeal, fungal, viral, and parasitic community proportions across cohorts (first stool sample only from each subject, n = 537); microbiome variation was measured by PERMANOVA based on Bray-Curtis dissimilarity matrices computed on relative abundance with cohort adjusted and marginal sums of squares applied, i.e., adonis2(relative abundance matrix ~ severity + cohort, permutations=999, method=“bray”, by=“margin”). Non-metric multidimensional scaling (NMDS) of microbiome-severity correlation based on species-level Bray-Curtis dissimilarity of pooled shotgun metagenomes with known disease severity (n =718) for (c) bacteria, (d) archaea, (e) fungi, (f) viruses, and (g) parasites; colored boxplots on the top and the right represent Bray-Curtis dissimilarity by disease severity in the first and second ordinations, respectively.
Supplemental Material
Download MS Excel (95.5 KB)Supplemental Material
Download MS Word (10.8 MB)Data availability statement
The raw sequencing data are available from public sources as identified in Table S1.