
Figures & data
Figure 1. Nuclear structure and nuclear lamina change during oogenesis. a. Shown is a schematic of an ovariole that carries advancing stages of oocyte maturation. At the anterior tip ovariole (left) is a germarium that contains the stem cell niche. Within the germarium, germline stem cells (GSCs) undergo asymmetric mitotic divisions producing one renewing and one differentiating daughter. Differentiation begins with four synchronous mitotic divisions that lead to the formation of a sixteen-cell cyst, comprised of fifteen nurse cells and one oocyte. In the posterior end of the germarium, the sixteen-cell cyst becomes encased by a monolayer of somatic follicle cells to form a Stage1 (S1) egg chamber (EC) that buds off from the germarium as a S2 EC. Continued differentiation is divided into morphologically distinct stages (up to S9 are shown), distinguished by the size and organization of NC (white circles) and oocyte nuclei (blue circles). The growing oocyte (black) is at the posterior of each EC. b. Confocal images of germaria, S6 and S9 ECs stained with antibodies against the B-type lamin (LamB) and the A-type lamin (LamC). White and yellow arrowheads indicate GSCs and NCs, respectively. White arrows indicate the position of the oocyte nucleus. Stages of EC development were based on morphology as described in [Citation64]. Scale bars, 5 µm. c., d. Shown are maximal projection confocal images of oocyte nuclei in a S6 and S9 ECs stained with antibodies N-terminal phospho-serine antibody (NT pSer, green) merged with a single Z-section image stained with antibodies against either LamB (white, c) or LamC (white, d). Scale bars, 5 µm.
![Figure 1. Nuclear structure and nuclear lamina change during oogenesis. a. Shown is a schematic of an ovariole that carries advancing stages of oocyte maturation. At the anterior tip ovariole (left) is a germarium that contains the stem cell niche. Within the germarium, germline stem cells (GSCs) undergo asymmetric mitotic divisions producing one renewing and one differentiating daughter. Differentiation begins with four synchronous mitotic divisions that lead to the formation of a sixteen-cell cyst, comprised of fifteen nurse cells and one oocyte. In the posterior end of the germarium, the sixteen-cell cyst becomes encased by a monolayer of somatic follicle cells to form a Stage1 (S1) egg chamber (EC) that buds off from the germarium as a S2 EC. Continued differentiation is divided into morphologically distinct stages (up to S9 are shown), distinguished by the size and organization of NC (white circles) and oocyte nuclei (blue circles). The growing oocyte (black) is at the posterior of each EC. b. Confocal images of germaria, S6 and S9 ECs stained with antibodies against the B-type lamin (LamB) and the A-type lamin (LamC). White and yellow arrowheads indicate GSCs and NCs, respectively. White arrows indicate the position of the oocyte nucleus. Stages of EC development were based on morphology as described in [Citation64]. Scale bars, 5 µm. c., d. Shown are maximal projection confocal images of oocyte nuclei in a S6 and S9 ECs stained with antibodies N-terminal phospho-serine antibody (NT pSer, green) merged with a single Z-section image stained with antibodies against either LamB (white, c) or LamC (white, d). Scale bars, 5 µm.](/cms/asset/3d112e07-38bc-44d9-88aa-53f6653de77d/kncl_a_2339214_f0001_oc.jpg)
Table 1. Germ cell localization pattern of Drosophila NL proteins during oogenesis.
Figure 2. Localization of LEM-D proteins and BAF during oogenesis. Confocal images of germaria and S6 ECs stained with antibodies that recognize LEM-D proteins (emerin, emerin2, and MAN1) or their protein partner, BAF. Stage 1 (S1) egg chambers are the first enveloped cysts within the germarium. White arrowheads mark the GSCs, yellow arrowheads mark the NCs, white arrows mark the oocyte and the yellow asterisk marks the fusome. Scale bars, 5 µm.
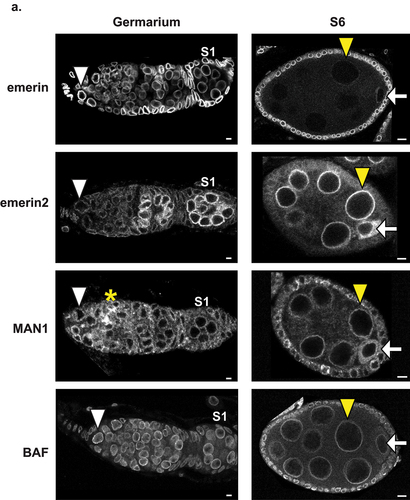
Figure 3. Ectopic production of LamC alters internal nuclear structure without affecting GSC maintenance. a. Individuals carrying the P[GAL4:VP16-nos] driver transgene were crossed with individuals carrying the UASp-lamC responder transgene to generate nos>lamC females. b. Confocal images of wild type or nos>lamC ovaries stained with antibodies against LamC (white), Vasa (red) and emerin (cyan). Scale bars, 5 µm. c. Confocal images of wild type or nos>lamC ovaries stained with antibodies against Fibrillarin (FBL, green) and LamB (white). Scale bars, 5 µm. d., e. Quantification of the nuclear perimeter (d) or Fibrillarin area (e) in wild type (WT) or nos>lamC (LC) GSCs. Statistical analysis used the unpaired two sample t-test. Asterisks indicate significance ** < 0.01, **** <0.0001. f. Confocal images of germaria in ovaries dissected from < 1- or 15-day females of indicated genotypes. Shown are maximum projection images of ovaries were co-stained with antibodies against pMad (green) and LamB (white). Scale bars: 5 μm. g. Quantification of the number of pMad positive cells from < 1-day and 15-day ovaries of indicated genotypes. Statistical analysis used the unpaired two sample t-test, ns= not significant. For all graphs (d,e,g) shown in this figure, each box represents the 25th to 75th percentile interval, the line represents the median and the whisker represents the 5th to 95th percentile interval and non-outlier range. Total number of germaria analyzed is noted above each top whisker.
![Figure 3. Ectopic production of LamC alters internal nuclear structure without affecting GSC maintenance. a. Individuals carrying the P[GAL4:VP16-nos] driver transgene were crossed with individuals carrying the UASp-lamC responder transgene to generate nos>lamC females. b. Confocal images of wild type or nos>lamC ovaries stained with antibodies against LamC (white), Vasa (red) and emerin (cyan). Scale bars, 5 µm. c. Confocal images of wild type or nos>lamC ovaries stained with antibodies against Fibrillarin (FBL, green) and LamB (white). Scale bars, 5 µm. d., e. Quantification of the nuclear perimeter (d) or Fibrillarin area (e) in wild type (WT) or nos>lamC (LC) GSCs. Statistical analysis used the unpaired two sample t-test. Asterisks indicate significance ** < 0.01, **** <0.0001. f. Confocal images of germaria in ovaries dissected from < 1- or 15-day females of indicated genotypes. Shown are maximum projection images of ovaries were co-stained with antibodies against pMad (green) and LamB (white). Scale bars: 5 μm. g. Quantification of the number of pMad positive cells from < 1-day and 15-day ovaries of indicated genotypes. Statistical analysis used the unpaired two sample t-test, ns= not significant. For all graphs (d,e,g) shown in this figure, each box represents the 25th to 75th percentile interval, the line represents the median and the whisker represents the 5th to 95th percentile interval and non-outlier range. Total number of germaria analyzed is noted above each top whisker.](/cms/asset/30d409d7-139e-427b-a4b4-37306c5f6674/kncl_a_2339214_f0003_oc.jpg)
Figure 4. Karyosome formation is unaffected in nos>lamC ovaries. a. Left: Confocal image of wild type (top) or nos>lamC (bottom) S6 ECs stained with antibodies against emerin (white) and DAPI (cyan). Scale bars: 5 μm. b. Quantification of the size of the karyosome in S6 ECs. Each box represents the 25th to 75th percentile interval, the line represents the median and the whisker represents the 5th to 95th percentile interval and non-outlier range. Total number of S6 ECs analyzed is noted above each top whisker. Statistical analyzes were performed using the unpaired two-sample t-test. Asterisks indicate significance: ns= not significant.
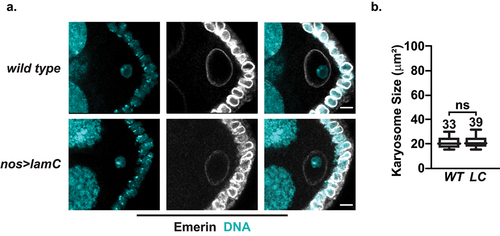
Figure 5. Ectopic production of LamC alters nuclear structure and function in S9 ECs. a. Confocal images of S9 wild type (top) or nos>lamC (bottom) ECs stained with antibodies against LamC (white) and N-terminal (NT) phosphoserine (green). Scale bars: 5 μm. Magnified images of boxed nuclei are shown below. Scale bars: 5 μm. b. Graph of the quantification of the intensity of the LamC staining in S9 oocyte nuclei in wild type (WT) or nos>lamC (LC) ovaries. c. Graph of the quantification of the intensity of the pSer staining in S9 oocyte nuclei of the indicated genotype. d. Graph of the quantification of perimeter of S9 oocyte nuclei of the indicated genotype. For NCs, the middle NC of the EC was chosen. e. Confocal image of wild type (top) or nos>lamC (bottom) ECs stained with antibodies against Fibrillarin (FBL, green) and Wheat Germ Agglutinin (WGA, Purple). Magnified images of boxed nuclei are shown below. Scale bars: 5 μm. f. Graph of the quantification of Fibrillarin intensity in middle NC of nuclei in S9 egg chambers of the indicated genotypes. g. Graph of the quantification of EU incorporation in NCs and oocytes of S9 ECs of the indicated genotypes. For each graph show in this figure (b, c, d, f, g), the box represents the 25th to 75th percentile interval, the line represents the median and the whisker represents the 5th to 95th percentile interval and non-outlier range. The total number of nuclei analyzed is noted above each top whisker. Asterisks indicate significance [Unpaired two sample t-test, *<0.05, ** <0.01, ***<0.0001, ns= not significant].
![Figure 5. Ectopic production of LamC alters nuclear structure and function in S9 ECs. a. Confocal images of S9 wild type (top) or nos>lamC (bottom) ECs stained with antibodies against LamC (white) and N-terminal (NT) phosphoserine (green). Scale bars: 5 μm. Magnified images of boxed nuclei are shown below. Scale bars: 5 μm. b. Graph of the quantification of the intensity of the LamC staining in S9 oocyte nuclei in wild type (WT) or nos>lamC (LC) ovaries. c. Graph of the quantification of the intensity of the pSer staining in S9 oocyte nuclei of the indicated genotype. d. Graph of the quantification of perimeter of S9 oocyte nuclei of the indicated genotype. For NCs, the middle NC of the EC was chosen. e. Confocal image of wild type (top) or nos>lamC (bottom) ECs stained with antibodies against Fibrillarin (FBL, green) and Wheat Germ Agglutinin (WGA, Purple). Magnified images of boxed nuclei are shown below. Scale bars: 5 μm. f. Graph of the quantification of Fibrillarin intensity in middle NC of nuclei in S9 egg chambers of the indicated genotypes. g. Graph of the quantification of EU incorporation in NCs and oocytes of S9 ECs of the indicated genotypes. For each graph show in this figure (b, c, d, f, g), the box represents the 25th to 75th percentile interval, the line represents the median and the whisker represents the 5th to 95th percentile interval and non-outlier range. The total number of nuclei analyzed is noted above each top whisker. Asterisks indicate significance [Unpaired two sample t-test, *<0.05, ** <0.01, ***<0.0001, ns= not significant].](/cms/asset/15361900-c163-4f27-a55d-1d60fef49a65/kncl_a_2339214_f0005_oc.jpg)
Figure 6. Effects of Lam C overexpression on fertility. a. Graphed is the fecundity (eggs per female per day) of wild type (solid) and nos>lamC (dashed) females over the course of forty days. All females were mated to wild type males. Asterisks indicate significance, determined for egg lays on every fifth day. [Unpaired two sample t-test, * < 0.05, ** < 0.01, ns= not significant] b. Graph of the percentage of eggs that hatched within 24 h following deposition by 4- and 7-day old females of indicated genotypes that were mated to wild type males. Bars represent the standard deviation from at least three independent experiments. The number of eggs analyzed is noted above each bar. Asterisks indicate significance [Unpaired two sample t-test ** < 0.01, *** < 0.001]. c. Scanning electron micrographs of eggs laid by wild type and nos>lamC females. The yellow arrowhead shows the micropyle and DA shows the location of the dorsal appendages. d. Graph of the percentage of developing embryos found in a 24-hr egg collection taken from females of the indicated genotypes [Unpaired two sample t-test, ns= not significant]. e. Graph of the percentage of dechorionated eggs that hatched into larvae that were laid by 4-day old wild type and nos>lamC females. [Unpaired two sample t-test, ns= not significant]. f. Graph of the percentage of female progeny eclosing from eggs laid by wild type and nos>lamC females [Unpaired two sample t-test, ns= not significant].
![Figure 6. Effects of Lam C overexpression on fertility. a. Graphed is the fecundity (eggs per female per day) of wild type (solid) and nos>lamC (dashed) females over the course of forty days. All females were mated to wild type males. Asterisks indicate significance, determined for egg lays on every fifth day. [Unpaired two sample t-test, * < 0.05, ** < 0.01, ns= not significant] b. Graph of the percentage of eggs that hatched within 24 h following deposition by 4- and 7-day old females of indicated genotypes that were mated to wild type males. Bars represent the standard deviation from at least three independent experiments. The number of eggs analyzed is noted above each bar. Asterisks indicate significance [Unpaired two sample t-test ** < 0.01, *** < 0.001]. c. Scanning electron micrographs of eggs laid by wild type and nos>lamC females. The yellow arrowhead shows the micropyle and DA shows the location of the dorsal appendages. d. Graph of the percentage of developing embryos found in a 24-hr egg collection taken from females of the indicated genotypes [Unpaired two sample t-test, ns= not significant]. e. Graph of the percentage of dechorionated eggs that hatched into larvae that were laid by 4-day old wild type and nos>lamC females. [Unpaired two sample t-test, ns= not significant]. f. Graph of the percentage of female progeny eclosing from eggs laid by wild type and nos>lamC females [Unpaired two sample t-test, ns= not significant].](/cms/asset/e7e97a6a-7c1c-458a-b926-d08bd3c42324/kncl_a_2339214_f0006_oc.jpg)
Supplemental Material
Download Zip (14.4 MB)Data availability statement
The Drosophila strains are available upon request. The data that support the findings of this study are openly available in https://doi.org/10.6084/m9.figshare.25250224. Supplemental files are published at figshare https://doi.org/10.6084/m9.figshare.25250224.