
Figures & data
Figure 1. Rents in TOD and TADs compared to the National Average, 2012–2016. Source: TOD Index.
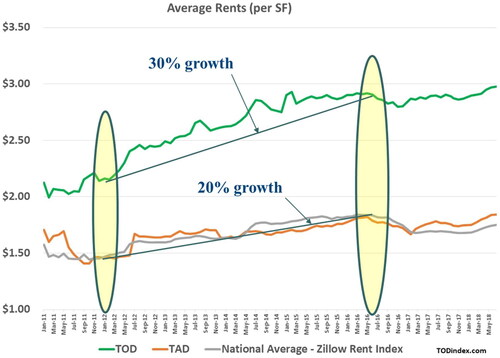
Table 1. List of variables.
Table 2. OLS rent change model estimates.
Table 3. HSAR rent change model estimated mean values of regression coefficients.
Table 4. Impact of a covariates effect on percentage of rent change.
Table 5. Comparing OLS and HSAR rent change model estimates.
Table 6. Random effect of regions of HSAR model.
Table 7. Summary of GWR rent change model estimates.
Table 8. Percent of census tracts where built environment variables had significant influence on rent change.
Table 9. Impact of key factors on rent change (2012–2016).