Figures & data
Figure 1. Ginkgo biloba extract (GBE) ameliorated skin fibrosis in bleomycin (BLM)-induced systemic sclerosis (SSc) mouse model. Mouse skin tissues were stained with hematoxylin and eosin (H&E) (A) and Masson’s trichrome (B) to visualize tissue morphology and collagen deposition, respectively. Original magnification: 40× or 100×. (C) The dermal thickness of each group (n = 9) was quantified. (D) The lesioned skins were analyzed by western blot to detect COL1A1 and α-SMA. GAPDH was used as loading control. BLM + GBE (100 mg/kg) group was used for the western blot analysis. (E and F) Band intensities from the western blot images were quantified by densitometry and the relative protein expression levels were compared with the PBS group. Data are presented as mean ± standard error of the mean (SEM). P-values were calculated using one-way ANOVA with Dunnett's post hoc test compared with the BLM group. *P < 0.05, ***P < 0.001. PBS, 1× DPBS injection group; BLM, Bleomycin injection group; BLM + GBE (100), Bleomycin injection and GBE (100 mg/kg) treatment group; BLM + GBE (200), Bleomycin injection and GBE (200 mg/kg) treatment group.
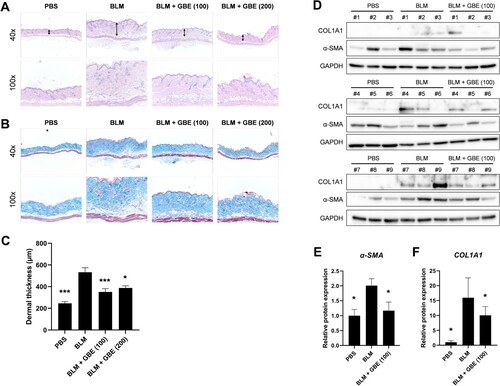
Figure 2. GBE downregulated the expression of fibrosis markers induced by TGF-β. (A and B) Mouse embryonic fibroblasts (NIH3T3) (A) and normal human dermal fibroblasts (B) were treated with TGF-β1 (10 ng/ml) and GBE for 24 h. The protein levels of COL1A1 and α-SMA were analyzed by western blot. Beta-actin or GAPDH was used as a loading control for western blot. (C–H) NIH3T3 cells (C–E) and normal human dermal fibroblasts (F–H) were treated with TGF-β1 (10 ng/ml) and GBE for 24 h and the relative mRNA expression levels of COL1A1, α-SMA, and CTGF were analyzed by qPCR. GAPDH was used as a normalization control for qPCR. Data are presented as mean ± SEM. P-values were calculated using one-way ANOVA with Dunnett's post hoc test compared with TGF-β1 group. ***P < 0.001.
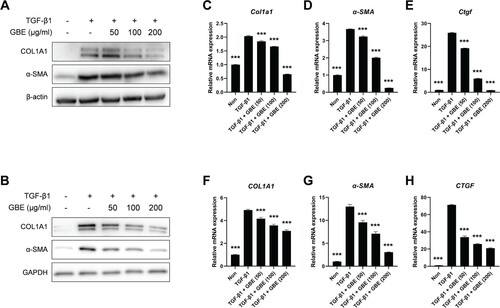
Figure 3. GBE inhibited transdifferentiation of adipocytes into myofibroblasts. (A–C) Murine preadipocytes, 3T3-L1, were cultured in adipogenic media for eight days to differentiate into adipocytes. The differentiated adipocytes were then transdifferentiated into myofibroblasts by treatment with TGF-β1 (10 ng/ml) for 48 h. Cells were also treated with GBE (50, 100, and 200 µg/ml). (A) Lipid was stained with Oil Red O and representative images were captured at ×100 magnification. (B) Relative lipid content from (A) was quantified using ImageJ. Data are presented as mean ± SEM. P-values were calculated using one-way ANOVA with Dunnett's post hoc test compared with the TGF-β1 group. *P < 0.05, **P < 0.01. (C) The protein levels of COL1A1 and α-SMA in the transdifferentiated myofibroblasts were analyzed by western blot. Beta-actin was used as a loading control.
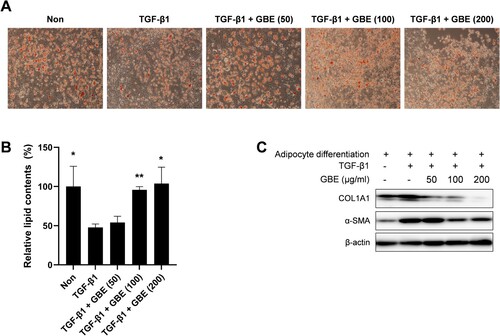
Figure 4. GBE inhibited TGF-β signaling in the fibroblasts. NIH3T3 cells (A and B) and normal human dermal fibroblasts (C–E) were treated with TGF-β1 (10 ng/ml) and GBE for 24 h. The protein levels of downstream targets (p-Smad2/3, active β-catenin, and p-AKT) of the TGF-β signaling pathway were analyzed by western blot. Beta-actin or GAPDH was used as a loading control.
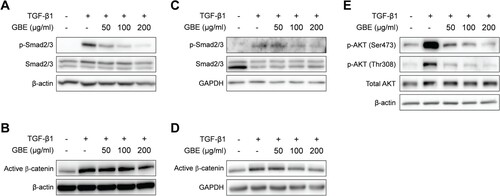
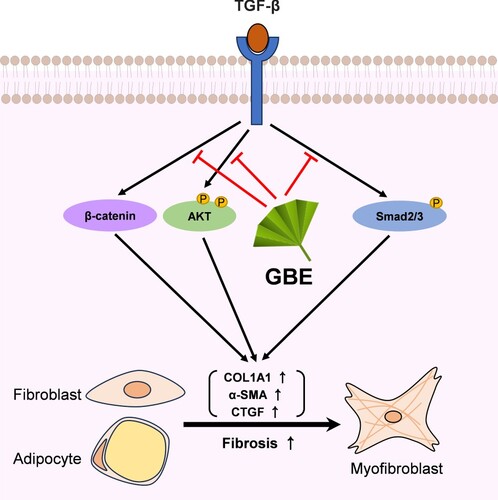
Figure 5. Proposed model illustrating the inhibitory effects of GBE on TGF-β downstream signaling pathways. TGF-β activates various downstream molecules, such as Smad2/3, β-catenin, and AKT, ultimately leading to fibrosis. GBE can modulate these TGF-β downstream signals, thereby inhibiting the fibrotic responses.