
Figures & data
Figure 1. Effects of sound vibration (SV) on cytokine secretion in mice. A. Schematic diagram of the experimental setup: Mice were divided into four groups (n = 6 per group, total n = 24). These included the groups injected with lipopolysaccharides (LPS) and then subjected to SV at 90 Hz (90) for 6 h or no SV stimulation (Non) or the groups without LPS, subjected to SV at 90 Hz (90) for 6 h or no SV stimulation (Non). B, Peritoneal lavages were collected and analyzed for the levels of interleukin (IL)-1β, IL-6, and IL-10. The bar graph presents the mean ± SD. *, P < 0.05.
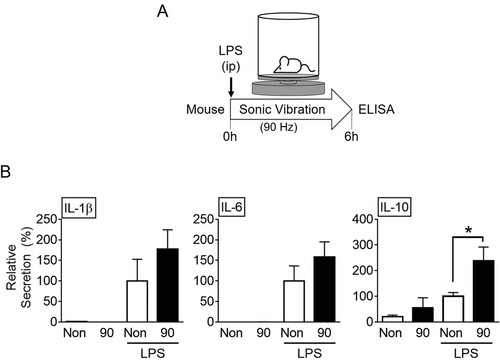
Figure 2. Effects of sound vibration (SV) on cytokine secretion in a time-dependent manner. Mice (n = 6 per group, total n = 36) were injected with lipopolysaccharides (LPS) and then subjected to SV at 90 Hz (90) for 6 h or overnight (o/n, 16 h) or no-SV stimulation (Non) or were subjected to SV at 90 Hz (90) for 6 h or overnight (o/n, 16 h) or no-SV stimulation (Non) without LPS. Peritoneal lavages (A) or blood (B) were collected and analyzed for the levels of interleukin (IL)-1β, IL-6, and IL-10. The bar graph presents the mean ± SD. *, P < 0.05.
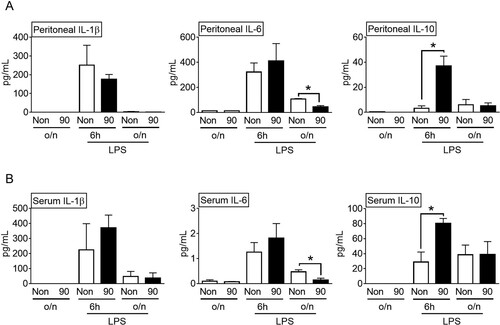
Figure 3. Effects of sound vibration (SV) on cytokine secretion in peritoneal exudate cells (PECs). Mice (n = 12 per group, total n = 48) were injected with lipopolysaccharides (LPS) (A) or monosodium uric crystals (MSU) (B) and then subjected to SV at 90 Hz (90) for 6 h or no-SV stimulation (Non). PECs were collected and analyzed for the levels of interleukin (IL)-1β, IL-6, and IL-10. The bar graph presents the mean ± SD. *, P < 0.05.
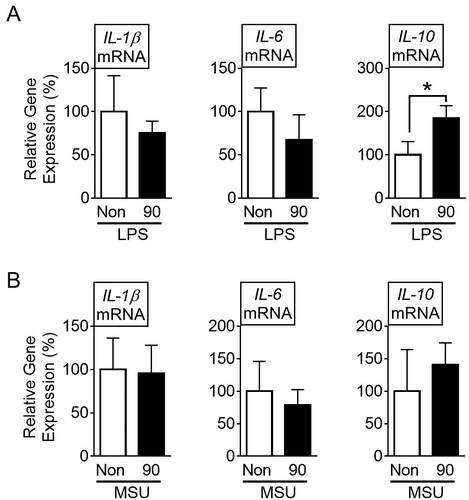
Figure 4. Effects of sound vibration (SV) on cytokine expression in BMDMs and THP-1 cells. Bone marrow-derived macrophages (BMDMs) (A and B) were treated with lipopolysaccharides (LPS) and then subjected to SV stimulation for 3 h or as indicated. Human macrophage-like cells (THP-1) (C) were treated with LPS and then stimulated by SV for 3 h. LPS-treated THP-1 (D) and BMDM (E) were treated with SB203580 (SB) or Bay 11-7082 (Bay) and then subjected to SV stimulation for 3 h. The gene expression of interleukin (IL)-1β, IL-6, and IL-10 was analyzed by quantitative reverse transcription-polymerase chain reaction (qPCR), and the secretion of IL-10 was measured by ELISA kit. The bar graph presents the mean ± SD with at least three independent experiments. *, P < 0.05.
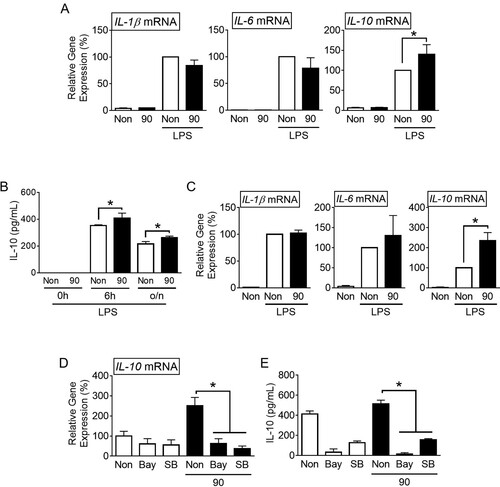
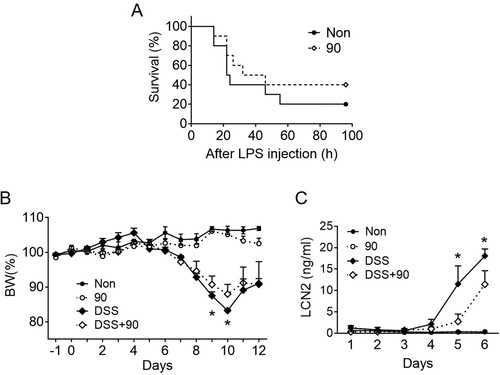
Figure 5. Effects of SV on LPS lethality and DSS-colitis. A, Mice (n = 10 per group, total n = 20) were subjected to daily sound vibration (SV, 90 Hz, 0.5 m/s2, 6 h/d) stimulation for 10d and then injected with a lethal dosage of lipopolysaccharides (LPS). Mortality was monitored after the LPS injection for up to 96 h and presented as a Kaplan-Meier survival plot. B and C, Mice (n = 4 per group, total n = 16) were provided with tap water containing dextran sodium sulfate (DSS) for 7d on day 0, and then the water was replaced with normal tap water. Body weight (B) was monitored daily under SV for 12d, and fecal lipocalin (LCN2) levels (C) were measured for 6d. The line graph presents the mean ± SD. *, P < 0.05 between DSS only vs DSS + 90.
Supplemental Material
Download PDF (437.2 KB)Data availability statement
The data used to support the findings of this study are available from the corresponding author upon request.