Figures & data
Figure 1. Measurements.
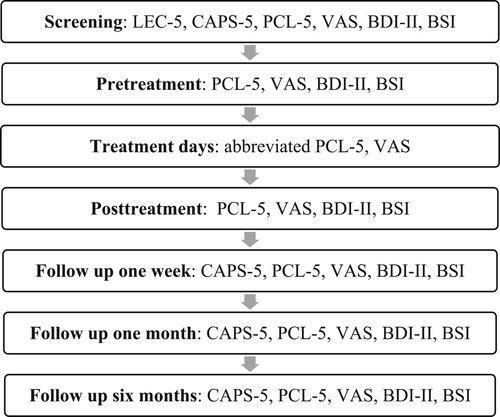
Table 1. Comorbid diagnosis.
Table 2. Mean scores and standard deviation of all measurement instruments and moments.
Figure 2. Course of PTSD symptoms on the CAPS-5.
Note: Error bars represent the standard error of the mean.
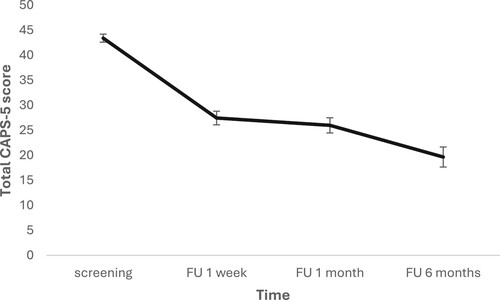
Table 3. Reliable Change Index (RCI).
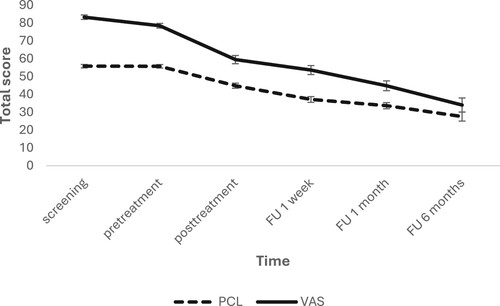
Figure 3. Course of self-reported PTSD symptoms on the PCL-5 and VAS.
Note: Error bars represent the standard error of the mean. The VAS scale ranges from 0–100. The PCL-5 ranges from 0–80.