
Figures & data
Table 1. Overview of studies estimating the exposure of the financial system to climate-related transition risks.
Table 2. Data description and sources.
Table 3. NACE Rev. 2 sectors and divisions linked to loan sectors of the QBS.
Table 4. Number of financial institutes by size (SZ) and bank group (BGRS) at the end of 2018.
Figure 1. GHG emissions and carbon intensities for Germany and EU-28, 2008 level = 100)
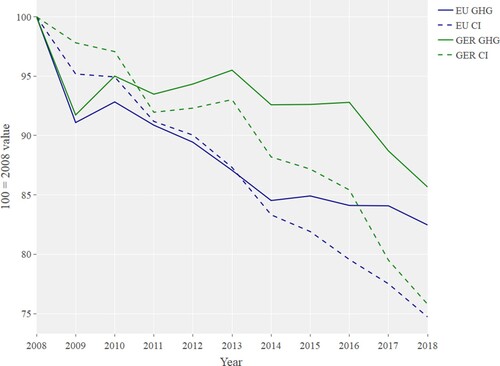
Table 5. Emission trends of the 10 highest emitting sectors in Germany in 2018.
Figure 2. Development of GHG emissions and carbon intensity (in %, aggregated sectors). Source: Authors elaboration based on Eurostat (Citation2021a) and Eurostat (Citation2021b). Sectors based on the NACE Rev. 2 classification.
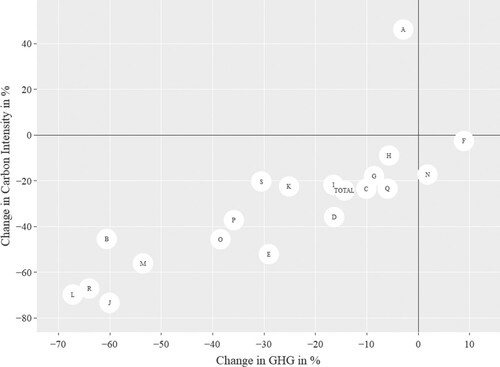
Figure 3. Development of GHG emissions and carbon intensity (in %, Top 10). Source: Authors elaboration based on Eurostat (Citation2021a, Citation2021b). Sectors based on the NACE Rev. 2 classification.
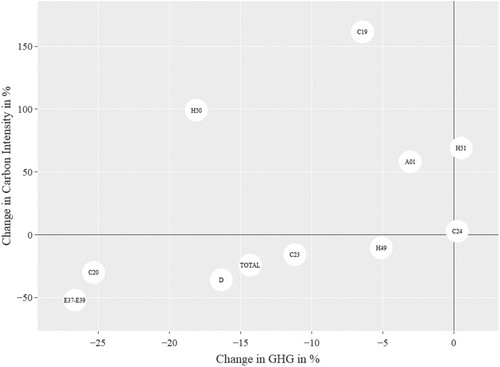
Table 6. Loan Carbon Intensity and other core variables computed for the QBS sectors (as of 2018).
Figure 4. Share of loans and LCI (left panel) and Share of loans and GHG emissions (right panel). Source: Research Data and Service Centre (RDSC) Deutsche Bundesbank, dataset: QBS, data period: 01.01.2008–31.12.2018, own elaborations.
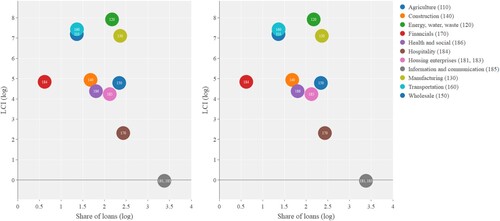
Figure 5. Changes (in %) of the main variables under scrutiny over the period 2008–2018. Source: Research Data and Service Centre (RDSC) Deutsche Bundesbank, dataset: QBS, data period: 01.01.2008–31.12.2018, own elaborations.
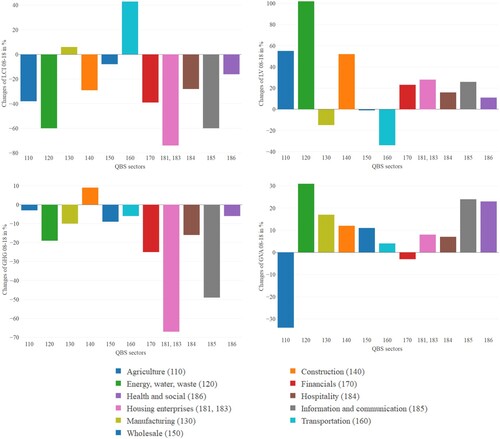
Figure 6. The German financial system. Source: Authors' elaboration.
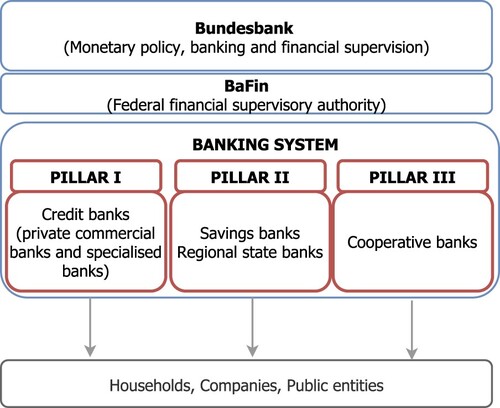
Figure 7. Distribution of loans to QBS sectors per size group as of 2008 and 2018. Source: Research Data and Service Centre (RDSC) Deutsche Bundesbank, datasets: BISTA, QBS, data period: 01.01.2008–31.12.2018, own elaborations.
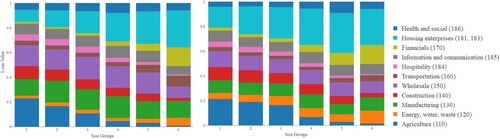
Figure 8. Distribution of loans to QBS sectors per bank group as of 2008 and 2018. Source: Research Data and Service Centre (RDSC) Deutsche Bundesbank, datasets: MaMFI, QBS, data period: 01.01.2008–31.12.2018, own elaborations.
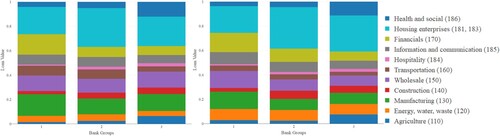
Table 7. Distribution of loan exposure to CPRS sectors for different size and bank groups in % as of 2018.
Table 8. Quantification of transition risks of the German banking system according to alternative methods.