Figures & data
Figure 1. Sampled populations from Limbe Health District (LHD) of the South West Region (SWR) and Ndop Health District (NHD) of the North West Region of Western Cameroon. (a) A zoomed-out map of collection sites from the NHD (Bambalang, Bamukumbit and Bamunka) and LHD (Mile 1, Bota and Bonadikombo). The insert shows the infection density (transmission intensity) from WHO, 2018 malaria report. Each red dot depicts a local hospital used for patient sampling. (b) Distribution of complexity of infection measured by MOI. (c) Distribution of diversity of infection measured by Nei expected heterozygosity index (He) between individual collection sites.
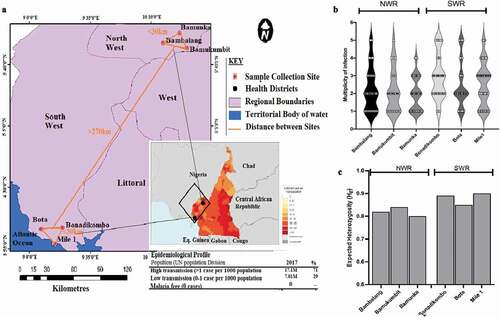
Table 1. Clinical and demographic characteristics of clinical isolates.
Table 2. Multi-locus linkage disequilibrium of P. falciparum infections from western highlands in the North West region and coastal lowland areas in the South West region of Cameroon.
Table 3. Pairwise Fst (bottom- half) and Jost’s D (top- half) between P. falciparum infections from western highlands in the North West region and coastal lowlands in the South West region of Cameroon.
Figure 2. Population structures and Ancestral origin of P. falciparum infections from two contrasting geo-ecological sites of Cameroon. (a) Scatter plot of discriminant analysis of principal components (DAPC) showing genetic clusters of P. falciparum infections (color-coded by collection site within the two regions) from collection sites. (b) Population clustering based on ancestral origin showing ancestry coefficients and optimum k means (k = 2 and k = 3). k = 2 produced two major population clusters (dark blue and red) while k = 3 produced the two major population clusters of microsatellite haplotypes and a common cluster (light blue). Black borders separate individual populations.
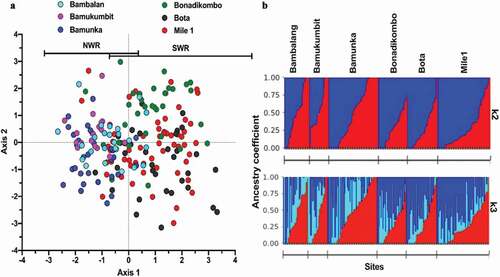
Figure 3. Genetic Relatedness of P. falciparum Infections from western highland areas and coastal lowland areas in Cameroon. (a) Average pairwise population differentiation with genetic and spatial distance between populations. (b) Distribution of p-values from simulated pairwise genetic distance versus physical distance relationships, showing significant correlation. (c) Pairwise Identity by state (IBS) between isolates within and between sites with threshold for relatedness, IBS > 0.5 demarcated by the gray line shown.