
Figures & data

Figure 1. Characteristic compressive stress–strain-curve.
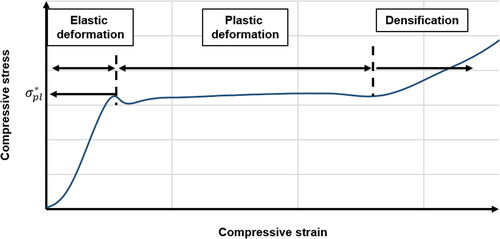
Figure 2. Young’s modulus for semi-crystalline (sc) and amorphous (a) thermoplastic polymers, based on [Citation11].
![Figure 2. Young’s modulus for semi-crystalline (sc) and amorphous (a) thermoplastic polymers, based on [Citation11].](/cms/asset/d7df0af5-6387-47fb-a81d-0f0b2b74ca8f/yadm_a_2269021_f0002_c.jpg)
Figure 3. Schematic drawing of the cross section of uniform density foam (left) and structural foam (right).
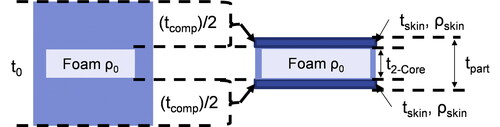
Figure 4. Selection of equivalent cross section models presented by Hobbs [Citation15].
![Figure 4. Selection of equivalent cross section models presented by Hobbs [Citation15].](/cms/asset/f8899ea9-45dd-4b45-a889-3455e03c405c/yadm_a_2269021_f0004_c.jpg)
Figure 5. Comparison of density and stress distribution in homogeneous foams, composite sandwich and structural foams, based on ref. [Citation17].
![Figure 5. Comparison of density and stress distribution in homogeneous foams, composite sandwich and structural foams, based on ref. [Citation17].](/cms/asset/59607406-b7fa-4d26-b418-2264c9d8c6fe/yadm_a_2269021_f0005_c.jpg)
Table 1. Properties of semi-finished materials.
Figure 6. Test setup in UTM and DMTA for compression tests.
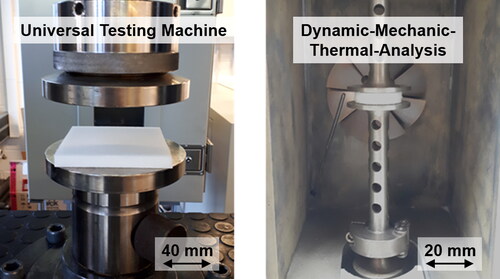
Table 2. Test series on UTM and DMTA.
Figure 7. Manufacturing thermoplastic structural foams in a hot press process [Citation4].
![Figure 7. Manufacturing thermoplastic structural foams in a hot press process [Citation4].](/cms/asset/946ad8f9-4838-41bb-95a2-bebb6858bdb1/yadm_a_2269021_f0007_c.jpg)
Table 3. Test series for manufacturing structural foam.
Figure 8. Test setup in hot press (left) and placement of thermocouples (right).
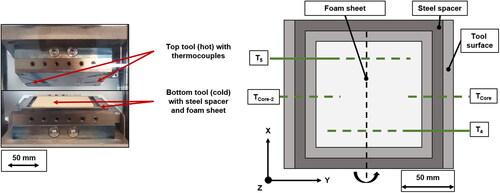
Figure 9. Process schematic for pressure and tool temperature in press program software.
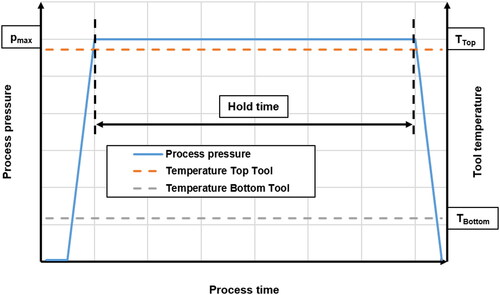
Figure 10. Exemplary comparison of process pressures—target values vs. recorded—(top), relative compaction (center), compaction speed during the process (bottom).
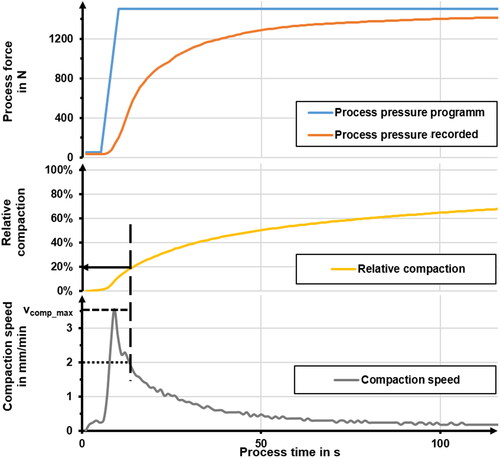
Figure 11. Exemplary comparison of relative compaction (top) and compaction speed (bottom) for different pmax at tool temperatures of 230 °C.
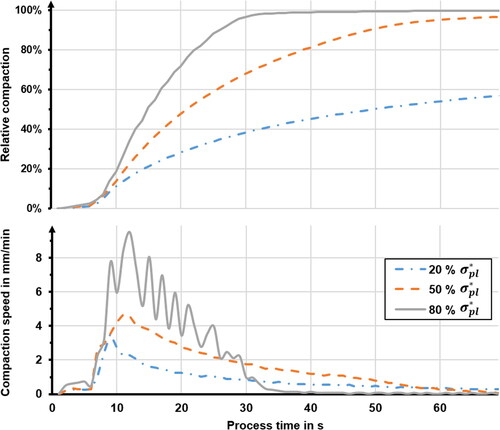
Figure 12. Measurement of foam sheet dimensions.
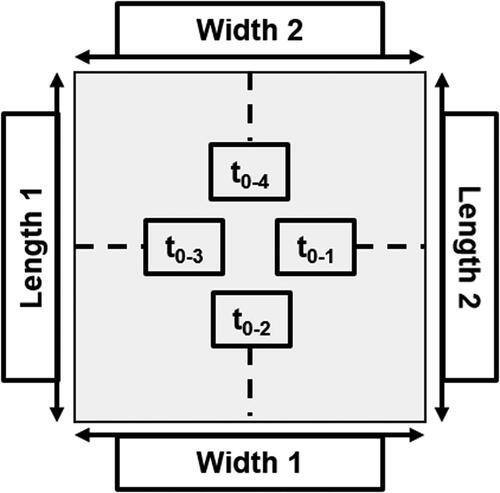
Figure 13. Schematic for three-point-bending tests [Citation33].
![Figure 13. Schematic for three-point-bending tests [Citation33].](/cms/asset/cecf1eb8-22e1-4878-b05e-337c4c3875ac/yadm_a_2269021_f0013_c.jpg)
Figure 14. Schematic for specimen preparation per individual foam sheet.
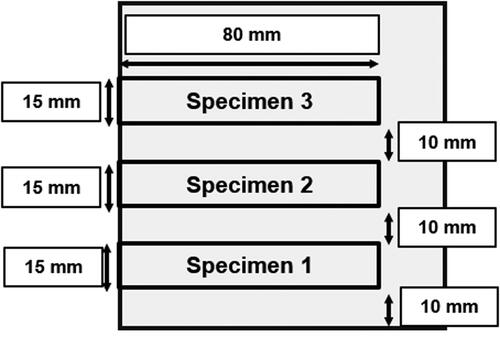
Table 4. Support length for different part thicknesses.
Figure 15. Comparison of theoretical bending moduli based on selected models.
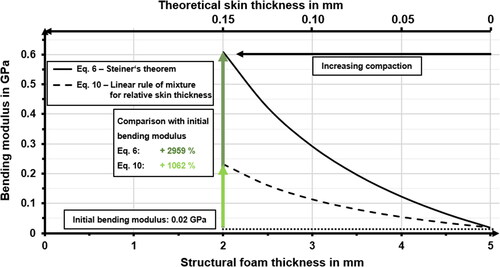
Figure 16. Quasi-static compressive behavior of Divinycell F50 at room temperature.
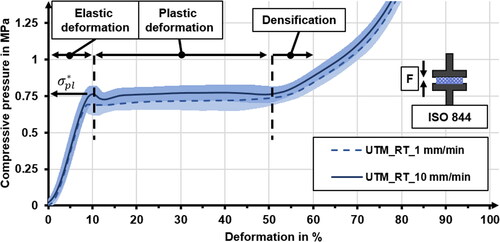
Figure 17. Quasi-static compressive behavior on Zwick at 215 °C and on DMTA at 215 and 222 °C.
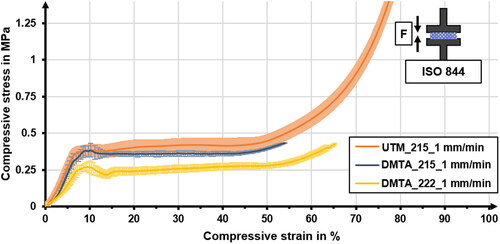
Figure 18. Influence of temperature on quasi-static compressive behavior at a crosshead speed of 1 mm/min.
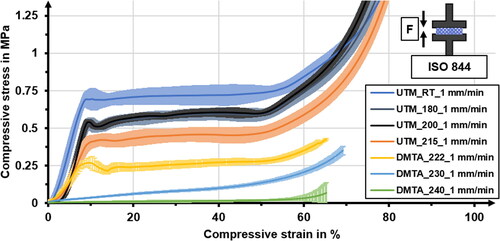
Figure 19. Influence of crosshead speed on compressive behavior at different test temperatures.
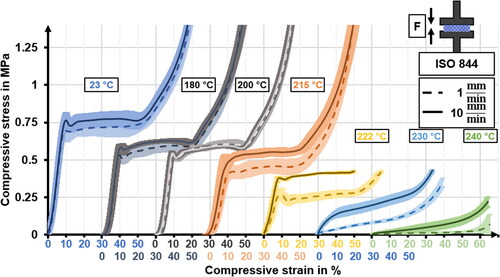
Table 5. Compressive strengths determined for different temperatures.
Figure 20. Influence of crosshead speed on compressive behavior at elevated temperatures.
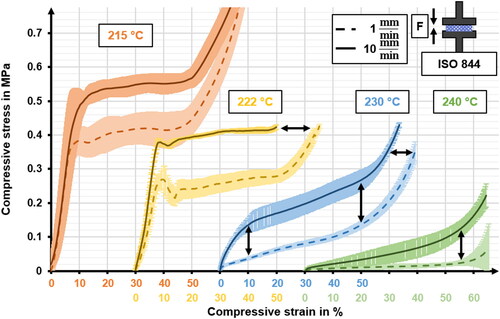
Table 6. Comparison of characteristic values derived from process data.
Figure 21. Comparison of foam thickness based on process data and manual measurement.
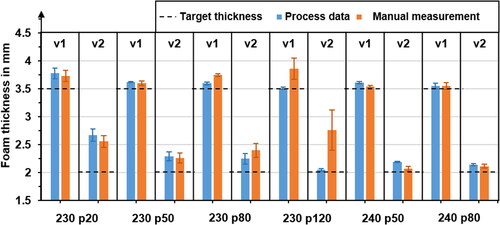
Figure 22. Structural foam density for different test series.
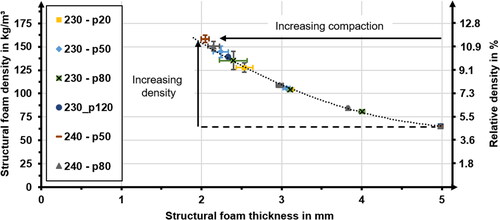
Figure 23. Comparison of surface and core temperature for different parameter combinations.
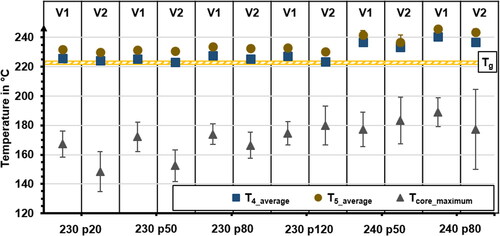
Figure 24. Comparison of pressure, compaction, and temperature progression during a hot press process.
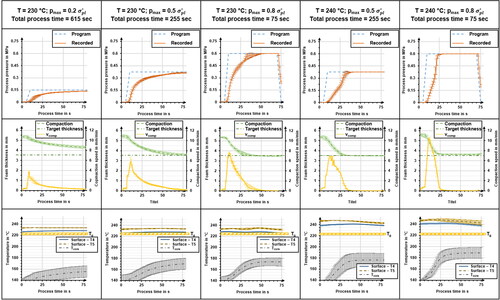
Figure 25. Relative compaction over time for different maximum pressures at 230 °C.
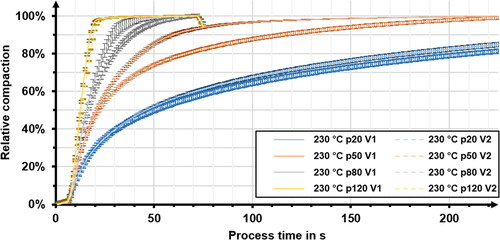
Figure 26. Maximum compaction speed during skin production.
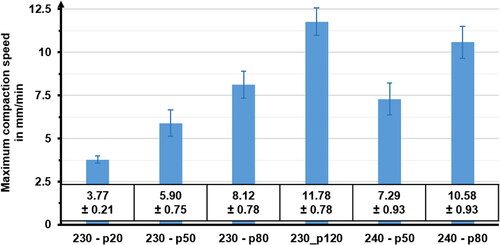
Figure 27. Relative compaction for different compaction speed ranges.
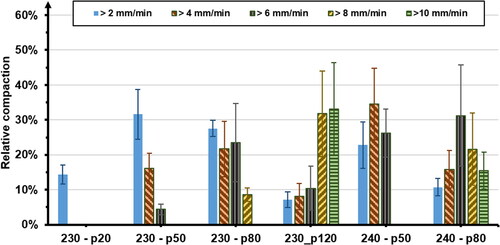
Figure 28. Bending moduli for structural foams.
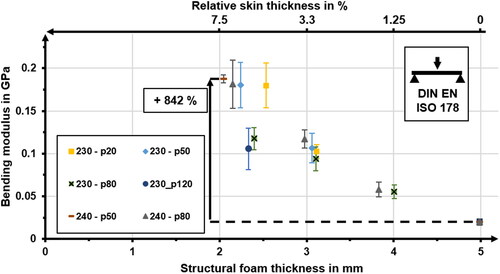
Figure 29. Bending strength for structural foams.
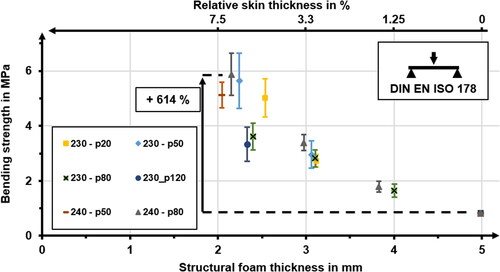
Figure 30. Relation of bending moduli and bending strengths in structural foams.
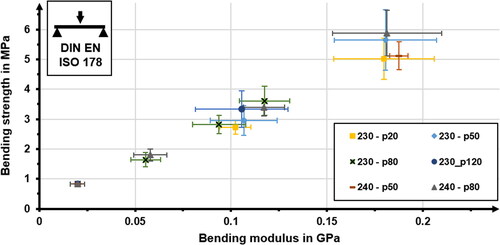
Figure 31. Deformation at bending strength for structural foams.
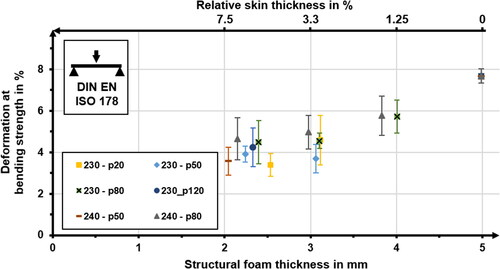
Figure 32. Qualitative comparison of different stress–strain-curves occurring during three-point-bending.
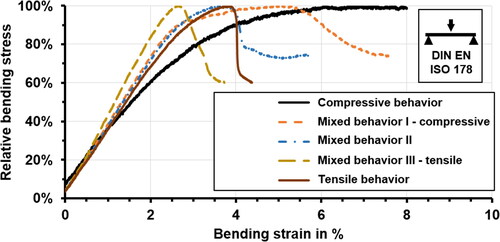
Figure 33. Impact of increasing compaction on qualitative failure behavior.
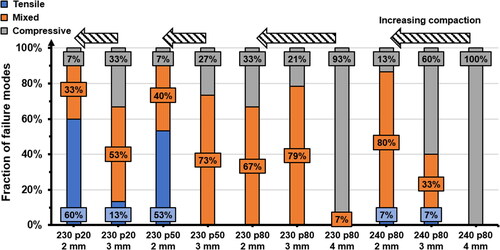
Figure 34. Impact of increasing process time on qualitative failure behavior.
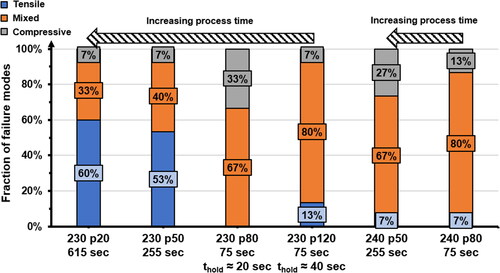
Figure 35. Comparison of measured values with theoretical models.
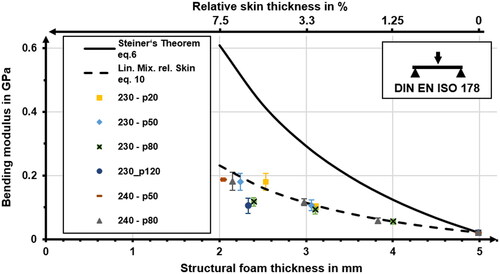
Figure 36. Comparison of measured and predicted Equation(Eq. 11)(11)
(11) bending moduli.
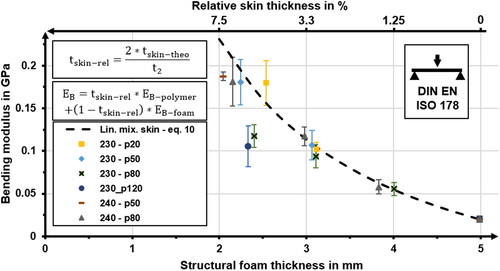
Figure 37. Comparison of the ratio of measured and predicted bending moduli.
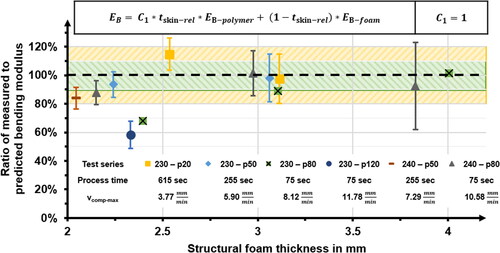
Figure 38. Comparison of measured and predicted (EquationEq. 17(17)
(17) ) bending strengths.
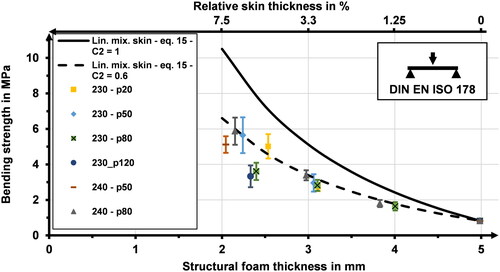
Figure 39. Comparison of the ratio of measured and predicted bending strengths.
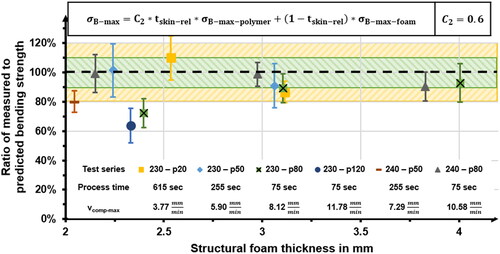
Table 7. Comparison of measured and predicted values for bending properties.
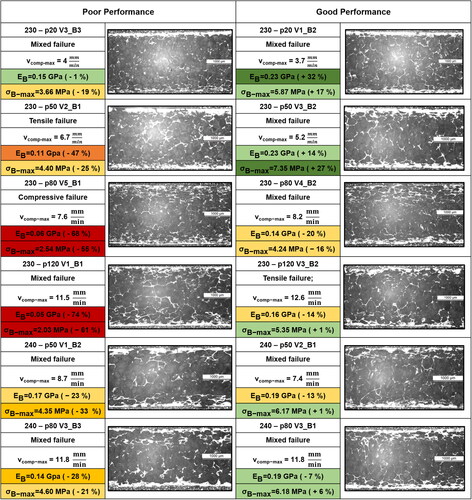
Figure 40. Comparison of performance and structure for structural foams manufactured with different process parameter sets.
Data availability
The data that support the findings of this study are available from the corresponding author, upon reasonable request.