Figures & data
Figure 1 Bridging of dry NCF in L-shaped mould (left) and resin-rich zone in a FRP component (right)
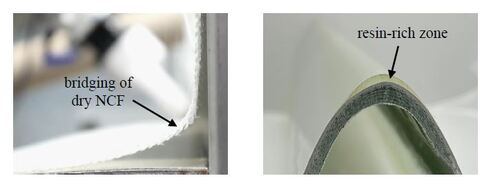
Figure 2 First layer (left) and third layer (right) of used triaxial NCF for the draping process, stitching parameters are listed in
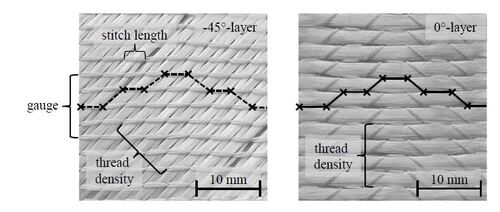
Table 1 Properties of used triaxial NCF
Figure 3 Used sample geometry (left) and schematic representation of the edge curvature (right)
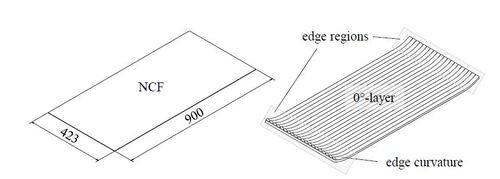
Figure 4 Draping of a dry NCF in a L-shaped mould (left), bridging after draping and value for the spring-back (right)
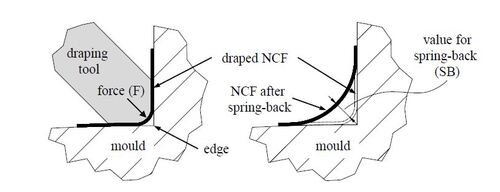
Figure 5 Used mould (left) and draping tool (right) for the automated draping process, all dimensions are given in millimetres (mm)
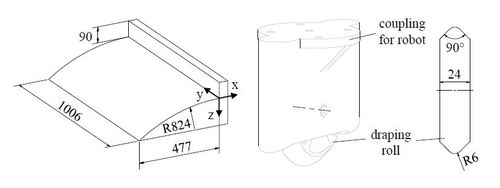
Figure 6 Automated draping process
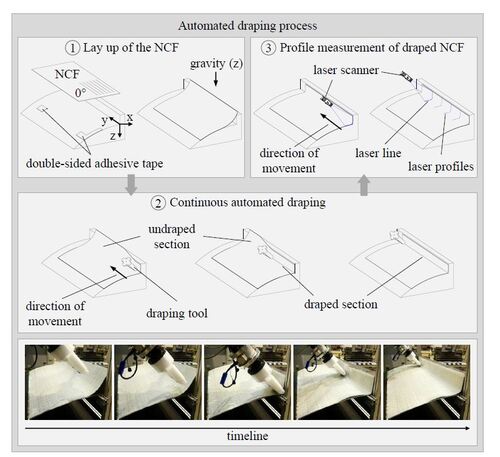
Table 2 Factors influencing the bridging of dry NCF in an automated draping process (bold: variable factors, italic: varying factors and normal: constant factors)
Figure 7 Schematic illustration of different drape force states
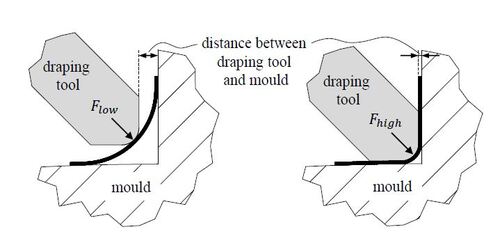
Figure 8 Illustration of variables to calculate the spring-back during draping (left) and surface scanning (right) for a profile cross section (for the origin of the coordinate system see )
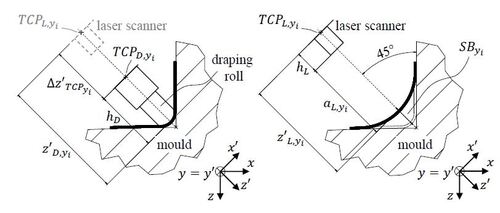
Figure 9 Average curves (n = 6) of spring-back against draping position for different velocities - exemplary curves for v = 10, 70 and 130 mm/s
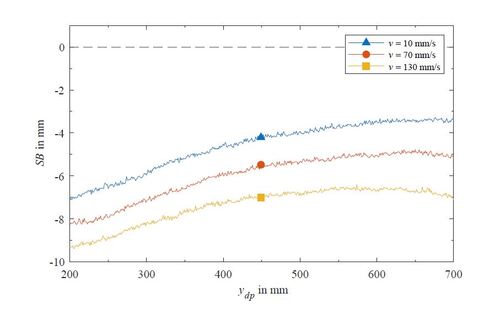
Table 3 Investigated levels of the factors (input variables) for preliminary tests
Table 4 Investigated levels of the factors velocity and force (input variables) for the main tests
Figure 10 Spring-back-curves for different velocities - exemplary curves for v = 10, 70 and 130 mm/s and its boxplots. The boxes and their whiskers indicate minimum, maximum, quartiles and median (basic boxplot withouts outliners) [Citation24]
![Figure 10 Spring-back-curves for different velocities - exemplary curves for v = 10, 70 and 130 mm/s and its boxplots. The boxes and their whiskers indicate minimum, maximum, quartiles and median (basic boxplot withouts outliners) [Citation24]](/cms/asset/0e0e75af-faa5-4044-ac1c-ac9131f7cab8/yadm_a_2286127_f0010.jpg)
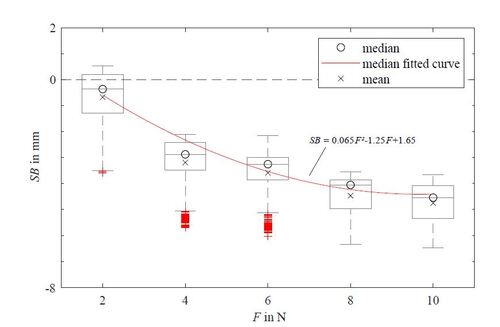
Figure 11 Boxplots of average curves of spring-back against velocity
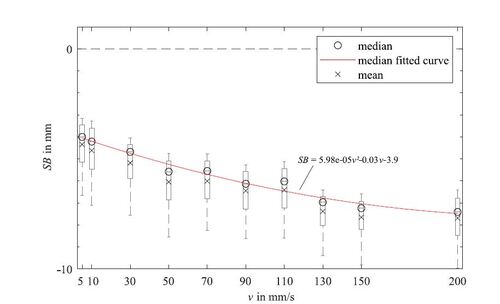
Figure 12 Average curves (n = 6) of spring-back against draping position for different forces - exemplary curves for and 10 N
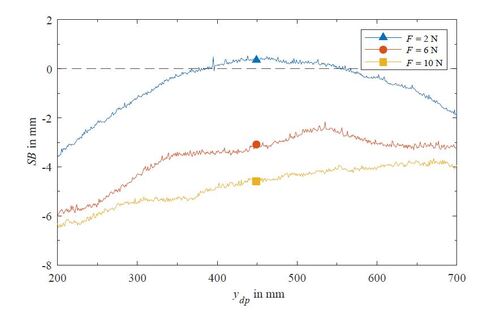
Figure 13 Boxplots of average curves of spring-back against force