
Figures & data
Figure 1. Phylogenetic analysis of the LASV strains tested in cynomolgus monkeys. the tree was inferred using the PhyML Smart Model Selection [Citation21] general time-reversible plus gamma plus proportion of invariable sites model, performed on the L gene of the different LASV strains. The L gene of the Mopeia virus strain an 20410 was used to root the tree. as the sequence of the Z-132 strain is not publicly available, we used the sequence of Z-148, which is genetically similar [Citation15]. The LASV lineage is indicated on the right.
![Figure 1. Phylogenetic analysis of the LASV strains tested in cynomolgus monkeys. the tree was inferred using the PhyML Smart Model Selection [Citation21] general time-reversible plus gamma plus proportion of invariable sites model, performed on the L gene of the different LASV strains. The L gene of the Mopeia virus strain an 20410 was used to root the tree. as the sequence of the Z-132 strain is not publicly available, we used the sequence of Z-148, which is genetically similar [Citation15]. The LASV lineage is indicated on the right.](/cms/asset/effe20ee-1cfe-4f85-ad57-a15d0cb02298/kvir_a_2060170_f0001_b.gif)
Table 1. Clinical, virological, and immunological findings in LASV-challenged monkeys. for the plasma concentrations of alanine transferase (ALT), aspartate transferase (AST), and C-reactive protein (CRP), + indicates 2 < fold increase (FI) < 5, ++ 5 <fi < 10, and +++ FI > 10. the day of observation is indicated within the parentheses. for viremia, + indicates a plasma titer between 102 and 104 FFU/mL, ++ between 104 and 105 FFU/mL, and +++ > 105 FFU/mL. LASV strain-specific IgG titers were measured by ELISA and + corresponds to titers below 1/1000; ++ between 1/1000 and 1/4000, and +++ > 1/4000. LASV strain-specific T-cell responses were measured by intracellular cytokine staining and the percentage of cytokine-positive (expressing IFNγ and/or TNFα) CD4+ and CD8+ T cells is indicated by + when between .1 and .2, ++ between .2 and .3, and +++ > .3. the time of death corresponds to the day of euthanasia (clinical score above 15 or terminal endpoint), surviving animals were euthanized at the end of the protocol on day 28
Figure 2. Quantification of soluble mediators in the plasma according to the time after LASV infection. Plasma concentrations of (a) pro-inflammatory cytokines, (b) anti-inflammatory cytokines, (c) T-cell response-related mediators, and (d) chemokines at various times post-challenge. IFN-α plasma concentrations were measured by ELISA. All other plasma concentrations were measured by Luminex assays.
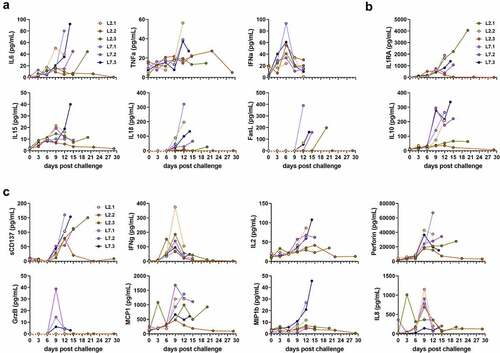
Figure 3. Transcriptomic analyses of PBMCs from infected animals. Gene expression heatmap of two gene sets: (a) antiviral response and (b) cytokine response. the standardized average expression (Standard aver. expr.) of the genes for each gene set was plotted against the time after challenge and normalized to day 0. for each gene set, a two-way ANOVA, adjusted for the viral strain and the day, was fitted to the standardized (centered and scaled) gene expression to summarize the global direction of regulation of the gene sets. Comparisons of average gene expression between day 0 and other days were performed using contrasts of the linear model (post-hoc Tukey HSD test). Red asterisks indicate significant differences from the expression on day 0 *P ≤.05, **P ≤.01, ***P ≤.001.
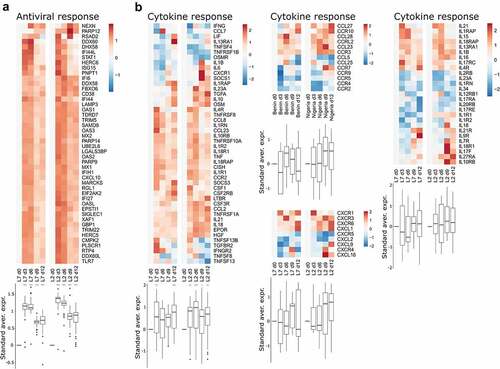
Figure 4. Transcriptomic analyses of PBMCs from infected animals. Gene expression heatmap of three gene sets: (a) monocyte response, (b) T-cell response, and (c) B-cell response. the standardized average expression (Standard aver. expr.) of the genes for each gene set was plotted against the time after challenge and normalized to day 0. for each gene set, a two-way ANOVA, adjusted for the viral strain and day, was fitted to the standardized (centered and scaled) gene expression to summarize the global direction of regulation of the gene sets. Comparisons of average gene expression between day 0 and other days were performed using contrasts of the linear model (post-hoc Tukey HSD test). Red asterisks indicate significant differences from the expression on day 0 *P ≤.05, **P ≤.01, ***P ≤.001.
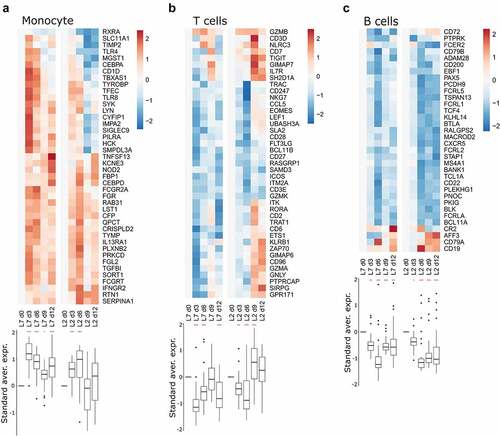
Figure 5. Comparative histopathology of the lung after challenge with L7 or L2 LASV strains. HE: hematoxylin-eosin coloration. Yellow arrowheads show severe (L7.1 and L2.1) or mild (L2.2) septal thickening. LASV: immunostaining of LASV glycoprotein-2c. Black arrowheads show infected cells. S100A9: immunostaining of neutrophils. GrB: immunostaining of cytotoxic cells. Scale bar: 100 µm.
Figure 6. Comparative histopathology of a mesenteric lymph node after challenge with L7 or L2 LASV strains. HE: hematoxylin-eosin coloration. LASV: immunostaining of LASV glycoprotein-2c. Black arrowheads show infected cells in the mantle, the germinal center and the cortical sinus. S100A9: immunostaining of neutrophils. GrB: immunostaining of cytotoxic cells. Scale bar: 100 µm.
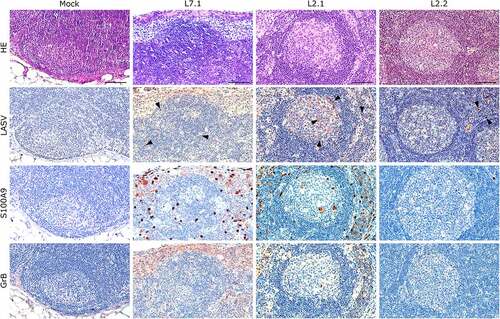
Figure 7. Comparative histopathology of the liver after challenge with L7 or L2 LASV strains. HE: hematoxylin-eosin coloration. Yellow arrowheads show signs of hepatic steatosis. LASV: immunostaining of LASV glycoprotein-2c. Black arrowheads show infected hepatocytes and interstitial cells, blue arrowheads show infected immune infiltrating cells. S100A9: immunostaining of neutrophils. GrB: immunostaining of cytotoxic cells. Scale bar: 100 µm.
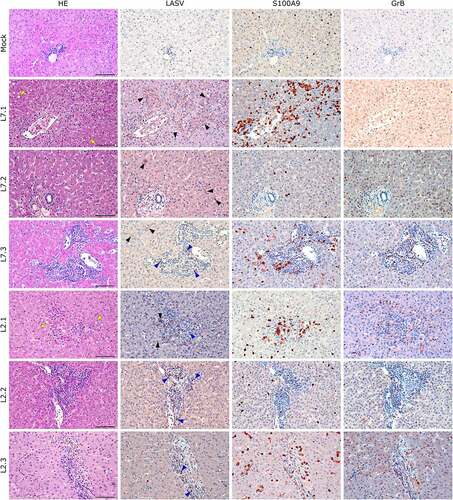
Figure 8. Comparative histopathology of the kidney after challenge with L7 or L2 LASV strains. HE: hematoxylin-eosin coloration. LASV: immunostaining of LASV glycoprotein-2c. Black arrowheads show infected endothelial cells, blue arrowheads show infected immune infiltrating cells. S100A9: immunostaining of neutrophils. GrB: immunostaining of cytotoxic cells. Scale bar: 100 µm.
Figure 9. Comparative histopathology of the brain and cerebellum after challenge with L7 or L2 LASV strains. HE: hematoxylin-eosin coloration. Iba-1: immunostaining of the microglia (dim in normal microglia, bright inactivated microglia). Scale bar: 250 µm. Scale bar in magnifications: 25 µm.
Supplemental Material
Download Zip (58.4 MB)Data availability statement
The data that support the findings of this study are available from the corresponding author upon reasonable request ([email protected]).