
Figures & data
Figure 1. Experimental design. Figure shows timeline of experimental design for all experimental groups, including avirulent rP2 PICV infection, virulent rP18 PICV infection, and mock infection (PBS injection). Dates of hearing loss testing via the auditory brainstem response (ABR) method, of sample collection, and of animal sacrifice are indicated for different groups of animals.
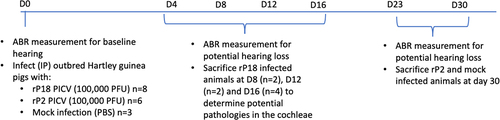
Figure 2. Morbidity, mortality, and viral kinetics of rP2- and rP18-infected outbred Hartley guinea pigs. Average bodyweights of virus-infected animals reported for each day following the infection and normalized to the bodyweight on the day of the infection (a). Average rectal temperatures in Celsius for each experimental group at each day of the infection (b). Serum’s viremia levels as determined by plaque assay (c). Statistical analyses were determined by mixed model analysis for , and by Student’s t-test for )2(c). For , the statistical significance of the differences between rP18 and rP2 was analyzed using an unpaired, two-tailed Student’s t-test for each individual time point. *=p < 0.05, **=p < 0.01, ***=p < 0.001, “NS” non-statistically significance.
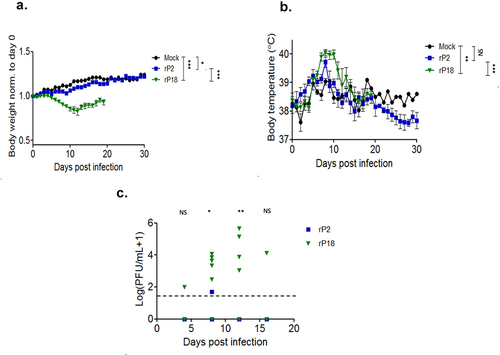
Figure 3. Virulent rP18-infected outbred Hartley guinea pigs experienced hearing loss. Figures are reported as the average changes in ABR thresholds from baseline decibel levels at day 0 for each experimental group in the left ear (a) and the right ear (b) when 2,000 Hz, 4,000 Hz, 8,000 Hz, 16,000 Hz, and 32,000 Hz of sound were used. Statistical analyses were performed using Kruskal–Wallis one-way ANOVA for each individual time point, comparing mock infection to rP2 infection (top), mock infection to rP18 infection (middle), and rP18 to rP2 infection (bottom). *=p < 0.05, **=p < 0.01, ***=p < 0.001, “NS” non-statistically significance.
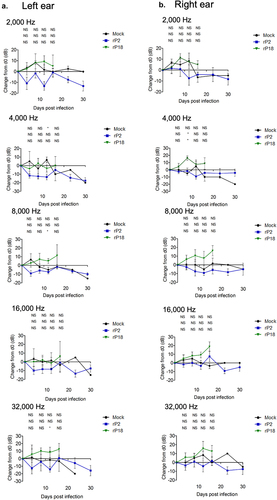
Figure 4. No correlation between viremia and hearing threshold levels in rP18-infected animals. Figures are reported as the changes in ABR thresholds from baseline decibel levels at day 0 for each rP18 cochlea tested at 2,000 Hz (a), 4,000 Hz (b), 8,000 Hz (c), 16,000 Hz (d), and 32,000 Hz (e) of sound and were compared to the serum’s viremia levels that were assessed at a time point when each ABR recording was taken. Statistical analyses were performed using linear regression, and the R2 values indicating no significant correlations were shown for each figure.
Table 1. Summary of hearing ability in individual rP2- or rP18-infected outbred Hartley guinea pig.
Figure 5. Lack of consistent cochlear pathology associated with hearing loss in virulent rP18-infected outbred Hartley guinea pigs.
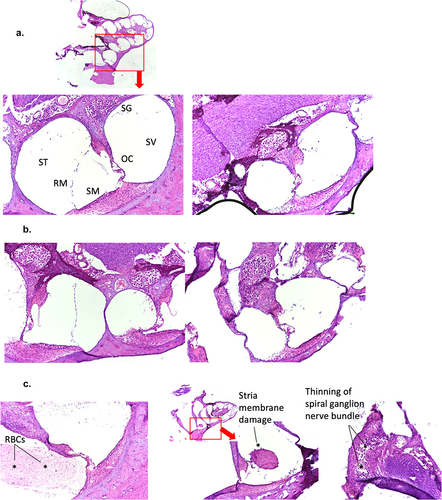
Figure 6. Presence of PICV RNAs in the cochlea of some rP18-infected animals with hearing loss. Frozen cochleae of rP2- and rP18-infected animals were homogenized and used to extract PICV RNAs for amplification by RT-qPCR. The absolute viral RNA copy numbers in the cochlea’s samples were determined based on a standard curve of DNA amplification of the PICV NP gene-containing plasmid. Data is reported for one of three RT-qPCR replicates, with similar results being found for the other replicates not shown. Statistical analyses were performed using Kruskal–Wallis one-way ANOVA. *=p < 0.05, **=p < 0.01, ***=p < 0.001, “NS” non-statistically significance.
Data availability statement
The data set linked with this submission can be found at 10.6084/m9.figshare.19352432