
Figures & data
Figure 1. Distribution of transposon insertion sites and correlation coefficients. (a) distribution of transposon insertion sites of the input library. the transposon insertion sites were mapped to the genome of ExPEC strain PCN033 and the data was visualized by using circos. Circle a represents the genome of ExPEC PCN033 strain. Circle B shows the transposon insertion sites. Circle C shows the mapped reads for each insertion site. The figure showed the data of one of the input libraries. (b) correlation coefficients between duplicates of input and output libraries. the correlation coefficients were calculated using the StandardScaler submodule of the sklearn module of the python programming language. DEseq2 was used to compare the change in the total number of insertion reads for each gene between the input and output libraries. Fold-change (FC) > 2 and p value <0.05 was used as the threshold to identify enriched genes.
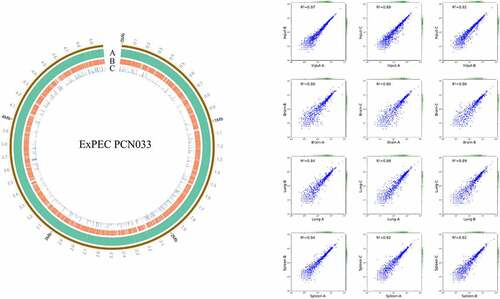
Figure 2. Genes essential for in vivo fitness. (a) venn diagram of the fitness genes identified in different organs. the diagram was generated by using Tbtools according to Table S3. (b) KEGG pathway enrichment of the fitness genes. the fitness genes were analyzed by using BlastKOALA tool (https://www.Kegg.jp/blastkoala/) to assign K numbers which were then used for pathway enrichment by using KEGG mapper (https://www.Genome.jp/kegg/mapper/search.Html). The numbers inside the vertical bars are the total number of genes belonging to each level 2 KEGG pathway. (c) COG enrichment of the fitness genes. the fitness genes were analyzed using the EggNOG v5.0 database (http://eggnog5.Embl.de/#/app/home).
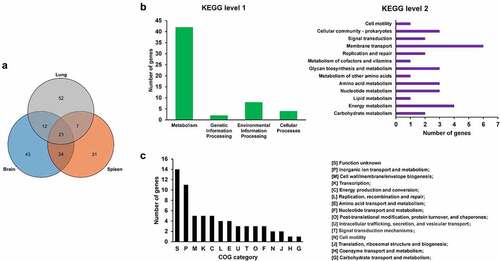
Figure 3. fimG is required for adhesion. (a) growth assay. Cells of WT and ΔfimG strains were inoculated 1:100 from overnight-grown culture to LB. The growth was monitored using an automatic plate reader (bioscreen C, FP-1100-C, oy growth curves AB, USA) at 37°C with shaking. Five replicates were tested for each strain. The data shown are the mean ± standard error of the mean (SEM). (b) competitive infection assay. 200 μL of cell suspension containing a total of 6 × 10⁵ CFU of WT and ΔfimG cells with a ratio of 1:1 was used to intraperitoneally inject mice with five mice in each group. At 12 hpi, mice were euthanized, and brain, spleen, and lung tissues were taken, homogenized, diluted, and plated on LB agar plates with and without appropriate antibiotics, respectively, to distinguish the mutant and the wild-type cells. The bacteria were enumerated and the competition index (CI) was calculated as defined as the mutant-to-WT ratio within the recovered sample, divided by the corresponding ratio in the inoculum. The student’s t test (two-tail, unpaired) was used to calculate the statistical difference between the mean CI value and 1. * indicates p <0.05 and ** indicates p <0.01. (c) cell adhesion assay. the bacterial cells at the mid-log phase were used to infect BHK-21 cells with a multiplicity of infection (MOI) of 10:1 in a six-well plate followed by incubation at 37°C for 1 h. The mixture was washed with sterile PBS and then sterile water was added to the mixture which was incubated at 4°C for 1 h for cell lysis. The lysate was serially diluted and applied to LB agar plates for bacterial counting. The student’s t test (two-tail, unpaired) was used to calculate the statistical difference between the two groups. * indicates p <0.05.
Figure 4. Rfa is critical for serum survival. (a) competitive infection assay. 200 μL of cell suspension containing a total of 6 × 10⁵ CFU of WT and Δrfa cells with a ratio of 1:1 was used to intraperitoneally inject mice with five mice in each group. At 12 hpi, mice were euthanized, and brain, spleen, and lung tissues were taken, homogenized, diluted, and plated on LB agar plates with and without appropriate antibiotics, respectively, to distinguish the mutant and the wild-type cells. The bacteria were enumerated and the competition was calculated. The student’s t test (two-tail, unpaired) was used to calculate the statistical difference between the mean CI value and 1. * indicates p <0.05, and ** indicates p <0.01. (b and c) growth assay. Cells of WT and Δrfa strains were inoculated 1:100 from overnight-grown culture to LB (A) or supplemented with 75% fresh mouse serum (B). The growth was monitored using an automatic plate reader (bioscreen C, FP-1100-C, oy growth curves AB, USA) at 37°C with shaking. Five replicates were tested for each strain. The data shown are the mean ± standard error of the mean (SEM). (d) serum killing assay. Cells of WT and Δrfa strains were subcultured in LB from overnight-grown culture and grown at 37°C to the mid-log phase. The cells were washed with sterile saline and 5 × 10⁵ CFU of the cells was incubated with 75% fresh (S) or heat-inactivated serum (IS) for 20 min at 37°C. Afterward, the mixture was serially diluted and plated on LB agar plates for viable cell enumeration. The assay was performed in triplicates and the data shown are the mean ± standard error of the mean (SEM). The student’s t test (two-tail, unpaired) was used to calculate the statistical difference between the two groups. *** indicates p <0.001.
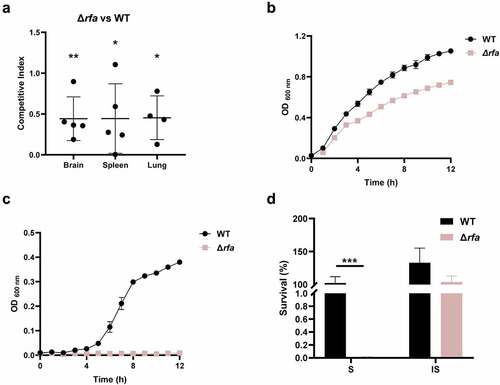
Figure 5. Fitness of metabolism-related mutants. (a, c, d, and f) growth assay. Cells of each indicated strain were inoculated 1:100 from overnight-grown culture to LB (a and e), M9 medium or M9 medium supplemented with the additives (D and G). The growth was monitored using an automatic plate reader (bioscreen C, FP-1100-C, oy growth curves AB, USA) at 37°C with shaking. Five replicates were tested for each strain. The data shown are the mean ± standard error of the mean (SEM). (b, e, and g) competitive infection assay. 200 μL of cell suspension containing a total of 6 × 10⁵ CFU of cells of WT and each indicated strain with a ratio of 1:1 was used to intraperitoneally inject mice with five mice in each group. At 12 hpi, mice were euthanized, and brain, spleen, and lung tissues were taken, homogenized, diluted, and plated on LB agar plates with and without appropriate antibiotics, respectively, to distinguish the mutant and the wild-type cells. The bacteria were enumerated and the competition index (CI) was calculated. The student’s t test (two-tail, unpaired) was used to calculate the statistical difference between the mean CI value and 1. ns indicates no significant difference, * indicates p <0.05, ** indicates p <0.01, *** indicates p <0.001.
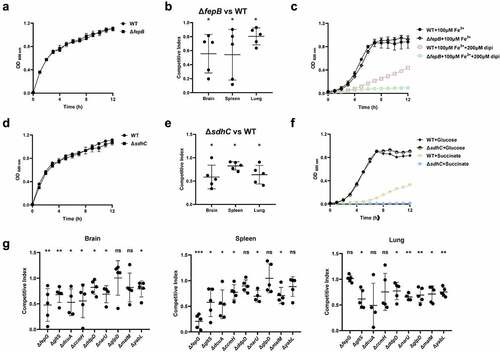
Figure 6. Mice survival assay. the indicated ExPEC strains were subcultured from overnight-grown cultures into LB and grown to the mid-log phase at 37°C with shaking. The cells were harvested by centrifugation, washed with sterile saline, and diluted to appropriate concentrations with saline. 0.2 ml of the bacteria suspension containing approximately 6.9 × 10⁵ CFU was used to infect 4-week-old Kunming mice intraperitoneally with 6 mice in each group (except the WT group which harbored 5 mice). The survival of mice was recorded. Statistical differences in survival between the mutant group and the WT group were determined using the log-rank test. * indicates p <0.05.
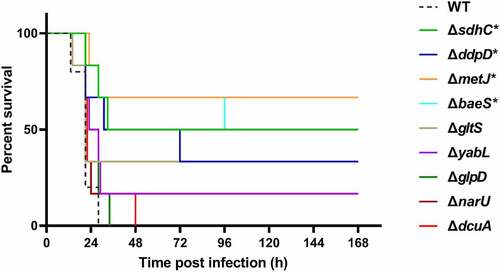
Figure 7. Two regulatory genes are critical fitness factors. (a) competitive infection assay. 200 μL of cell suspension containing a total of 6 × 10⁵ CFU of cells of WT and each indicated strain with a ratio of 1:1 was used to intraperitoneally inject mice with five mice in each group. At 12 hpi, mice were euthanized, and brain, spleen, and lung tissues were taken, homogenized, diluted, and plated on LB agar plates with and without appropriate antibiotics, respectively, to distinguish the mutant and the wild-type cells. The bacteria were enumerated and the competition index (CI) was calculated. The student’s t test (two-tail, unpaired) was used to calculate the statistical difference between the mean CI value and 1. ** indicates p <0.01, and *** indicates p <0.001. (b) cell adhesion assay. the bacterial cells at the mid-log phase were used to infect BHK-21 cells with a multiplicity of infection (MOI) of 10:1 in a six-well plate followed by incubation at 37°C for 1 h. The mixture was washed with sterile PBS and then sterile water was added to the mixture which was incubated at 4°C for 1 h for cell lysis. The lysate was serially diluted and applied to LB agar plates for bacterial counting. (c) macrophage phagocytosis assay. the bacterial cells were mixed with RAW 264.7 cells with a multiplicity of infection (MOI) of 10:1 followed by incubation at 37°C for 1 h. The cells were then washed twice with sterile PBS, and incubated with PBS containing chloramphenicol (final concentration 50 μg/ml). The macrophage cells were then lysed with sterile water and the lysate was serially diluted and applied to LB agar plates for bacterial counting. The student’s t test (two-tail, unpaired) was used to calculate the statistical difference between the two groups. ns indicates no significant difference, * indicates p <0.05, ** indicates p <0.01, ** indicates p <0.001.
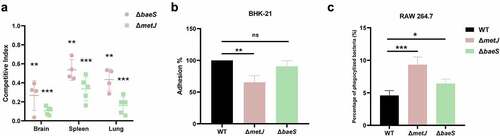
Table 1. Summary of competitive index.
Supplemental Material
Download Zip (1.6 MB)Data availability statement
The Tn-seq data are accessible via the link: https://www.ncbi.nlm.nih.gov/geo/query/acc.cgi?acc=GSE197084 by the using secure token: sbobaoowhdynjor.