1,373
Views
3
CrossRef citations to date
0
Altmetric
Research Article

Nomogram for evaluating obvious liver inflammation in treatment-naïve HBeAg positive chronic hepatitis B virus infection patients with normal ALT

, , , , , , , , , , ORCID Icon, ORCID Icon & ORCID Icon show all
Article: 2158710 | Received 11 Jul 2022, Accepted 11 Dec 2022, Published online: 04 Jan 2023

Figures & data

Table 1. Baseline characteristics of model cohort and validation cohort.

Table 2. Comparison between non-significant liver inflammation group and significant liver inflammation group in the model cohort.

Table 3. Univariate logistic regression analysis of factors for obvious liver inflammation in the model cohort.

Table 4. Multivariate logistic analysis of significant liver inflammation in the model cohort.

Table 5. Point assignment and risk of the scoring system on significant liver inflammation.

Figure 1. Nomogram for predicting significant liver inflammation based on model cohort. Abbreviations: qHBeAg, quantitative HBeAg; AST, aspartate aminotransferase; PLT, platelet.
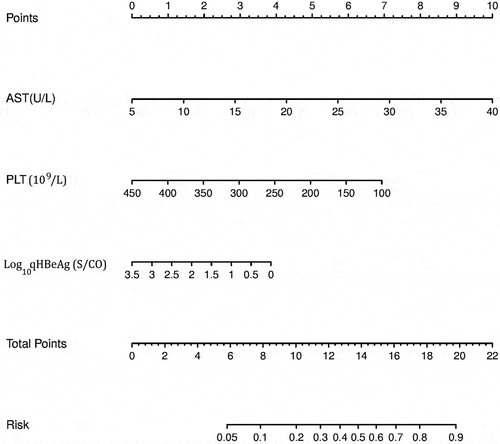
Figure 1. Nomogram for predicting significant liver inflammation based on model cohort. Abbreviations: qHBeAg, quantitative HBeAg; AST, aspartate aminotransferase; PLT, platelet.

Figure 2. The calibration curve of significant liver inflammation nomogram on the model cohort. Predicted and actual liver inflammation probability were respectively plotted on the X-axis and the Y-axis. The 45-degree dashed lines through the coordinate origin represent the excellent calibration models. Bootstraps with 200 resamples were adopted.
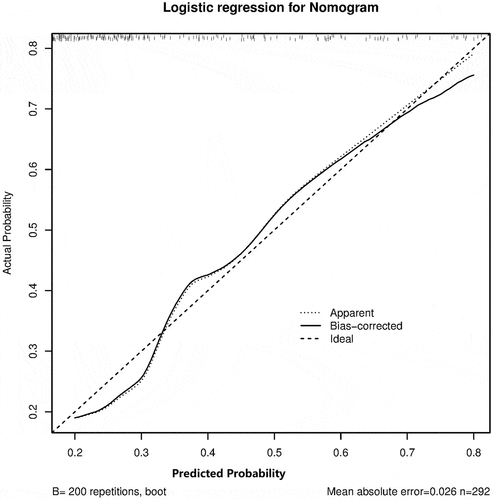
Figure 2. The calibration curve of significant liver inflammation nomogram on the model cohort. Predicted and actual liver inflammation probability were respectively plotted on the X-axis and the Y-axis. The 45-degree dashed lines through the coordinate origin represent the excellent calibration models. Bootstraps with 200 resamples were adopted.

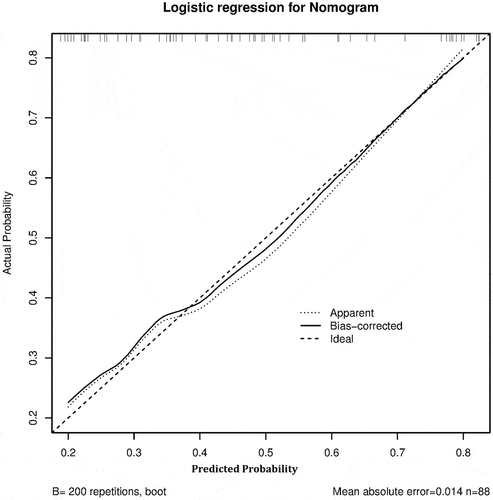
Figure 3. The calibration curve of significant liver inflammation nomogram on the validation cohort. Bootstraps with 200 resamples were adopted.

Figure 3. The calibration curve of significant liver inflammation nomogram on the validation cohort. Bootstraps with 200 resamples were adopted.

Data availability statement

The data used to support the findings of this study are available from the corresponding author upon request.