Figures & data
Table 1. Plasmids used in this study.
Table 2. Primers used in qRT-PCR.
Table 3. The sequences of primers used in generating deletion mutants and the lppA complementation strain.
Figure 1. Resistin secreted by PAMs damages monolayer PAECs integrity. (a, b) H. parasuis (100 MOI) infected wild-type or resistin knockout PAMs. PAMs lysates were taken 2 h after infection. The resistin expression was determined using western blot analysis (A), and the mRNA resistin level was analysed using qRT-PCR (B). The antibodies against resistin and β-actin were diluted at 1/1000 and 1/50000, respectively. β-actin served as a loading control, and the relative resistin levels of wild-type cells were calculated with ImageJ software and normalized to β-actin. **p<0.01 compared with the uninfected wild-type group. (c) Wild-type or resistin knockout PAMs were co-cultured with PAECs. TEER of PAECs was measured at 0, 6, 12, 24, 48, and 2 h after PAMs were infected with H. parasuis (100 MOI). The TEER levels were displayed as a percentage of the TEER before treatment. The mean ± SEM (n = 3) is presented as a representative result of three independent tests. **p<0.01 compared with the wild-type group.
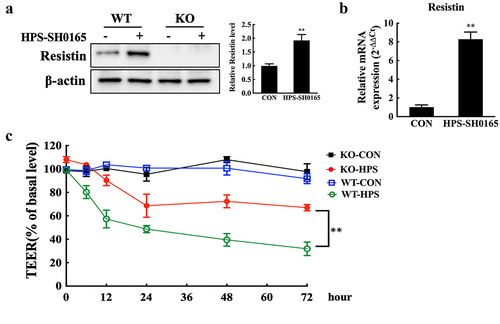
Figure 2. Resistin inhibits claudin-5 and occludin expression in PAECs. (a, b, c) PAECs were co-cultured with wild-type or resistin knockout PAMs, and the PAMs were infected by H. parasuis (100 MOI) for 2 h. mRNA levels of claudin-5, occludin, JAM-1, JAM-2, and VE-cadherin in PAECs were determined using qRT-PCR (a, b), and relative protein levels were detected using western blot analysis (c). (d, e, f) PAECs were stimulated or unstimulated with recombined resistin protein (2.5, 5, or 0 nM) for 2 h. Cells were lysed, mRNA levels of claudin-5 and occludin were analysed using qRT-PCR (d, e), and protein levels were analysed using western blot analysis (f). The mRNA level of each gene was standardized to GAPDH. The antibodies against claudin-5, occludin, JAM-1, JAM-2, and VE-cadherin were diluted at 1/1000, and the antibody against β-actin was diluted at 1/50000. β-actin served as a loading control, and the relative protein level was calculated with ImageJ software and normalized to β-actin. **p<0.01 compared with the wild-type group (a, b, c) or the untreated group (d, e, f). ##p<0.01 compared with the untreated group. Error bars represent the mean ± SEM (n = 3).
Figure 3. Resistin regulates AMPK/mTOR pathway activity in PAECs. (a) PAECs were co-cultured with wild-type or resistin knockout PAMs, and the PAMs were infected by H. parasuis (100 MOI) for 2 h. Lysates of PAECs were collected and subsequently analysed for the protein levels of phospho-AMPK (S458), AMPK, phospho-mTOR (S2448), and mTOR using western blot analysis. β-actin served as a loading control. (b) PAECs were stimulated or unstimulated with recombined resistin protein (2.5, 5, or 0 nM) for 2 h. The expression of related proteins was analysed the same as above. The antibodies against phospho-AMPK (S458), AMPK, phospho-mTOR (S2448), and mTOR were diluted at 1/1000, and the antibody against β-actin was diluted at 1/50000. β-actin served as a loading control, and the relative protein level was calculated with ImageJ software and normalized to β-actin. **p<0.01 compared with the wild-type group (a) or the untreated group (b). Error bars represent the mean ± SEM (n = 3).
Figure 4. Resistin modulates claudin-5 and occludin expression through the AMPK/mTOR pathway. PAECs were treated or untreated with AMPK activator (Metformin) or mTOR inhibitor (KU-0063794) for 2 h before being stimulated or unstimulated with recombined resistin protein (2.5, 5, or 0 nM) for 2 h. mRNA levels of claudin-5 and occludin were analysed using qRT-PCR (a-d) and protein levels were analysed using western blot analysis (e, f); the mRNA levels of each gene were standardized to GAPDH. The antibodies were diluted as previously described. β-actin served as a loading control, and the relative protein level was calculated with ImageJ software and normalized to β-actin. **p<0.01 and ##p<0.01 compared with the resistin-treated (without inhibitors) group. Error bars represent the mean ± SEM (n = 3). (g) TEER of PAECs was measured at 0, 6, 12, 24, 48, and 2 h after recombined resistin protein treatment (0 nM). The TEER levels were displayed as a percentage of the TEER before treatment. **p<0.01 compared with the untreated group. Error bars represented the mean ± SEM (n = 3).
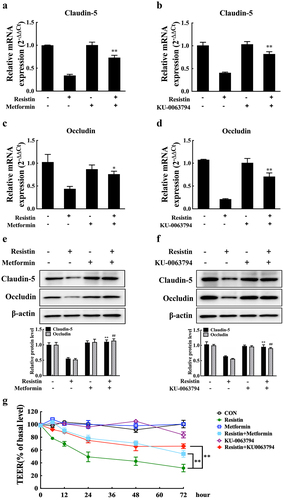
Figure 5. H. parasuis-induced resistin in PAMs modulates AMPK/mTOR pathway activity through LKB1 in PAECs. (a) PAECs were co-cultured with wild-type or resistin knockout PAMs, and the PAMs were infected by H. parasuis (100 MOI) for 2 h. Protein levels of phospho-LKB1 (T189), LKB1, phospho-CaMKK2 (S511), and CaMKK2 in PAECs were detected using western blot. (b) Western blot analysis of full-length LKB1 or CaMKK2 expression in PAECs. PAECs seeded on six-well plates were transfected with 2.5 μg/well plasmids pCAGGS-LKB1 or pCAGGS-CaMKK2 by 5 μg/well of lipofectamine 2000. Cells were collected to detect LKB1 and CaMKK2 expression levels using western blot analysis at 8 h post-transfection. The empty vector was used as a negative control. (c, d) pCAGGS-LKB1 or pCAGGS-CaMKK2 were transfected into PAECs, cells were co-cultured with wild-type or resistin knockout PAMs 4 h after transfection, and the PAMs were then infected by H. parasuis (100 MOI) for 2 h. Protein levels of phospho-AMPK (S458) and AMPK (c) or claudin-5 and occludin (d) in PAECs were determined using western blot analysis. β-actin served as a loading control. The antibodies against phospho-LKB1 (T189), LKB1, phospho-CaMKK2 (S511), and CaMKK2 were diluted at 1/1000, and the antibody against β-actin was diluted at 1/50000. β-actin served as a loading control, and the relative protein level was calculated with ImageJ software and normalized to β-actin. **p<0.01 compared with the uninfected group (a, c, d). ##p<0.01 compared with the HPS-infected group (c, d). Error bars represent the mean ± SEM (n = 3).
Figure 6. Resistin regulates monolayer PAECs integrity by the LKB1/AMPK/mTOR pathway. Plasmids pCAGGS-LKB1 or pCAGGS-CaMKK2 were transfected into PAECs. 4 h after transfection, PAECs were treated with recombined resistin protein (0 nM) for another 2 h, and cells were then collected for qRT-PCR analysis (a, b) or western blot analysis (c, d). The empty vector was used as a negative control. The antibodies were diluted as previously described. β-actin served as a loading control, and the relative protein level was calculated with ImageJ software and normalized to β-actin. **p<0.01 compared with the untreated group, ##p<0.01 compared with the resistin-treated group. Error bars represent the mean ± SEM (n = 3). (e) TEER measurement of PAECs was taken at 0, 6, 12, 24, 48, and 2 h after recombined resistin protein treatment (0 nM). TEER levels were displayed as a percentage of the TEER before treatment. **p<0.01 compared with the negative control group. Error bars represented the mean ± SEM (n = 3).
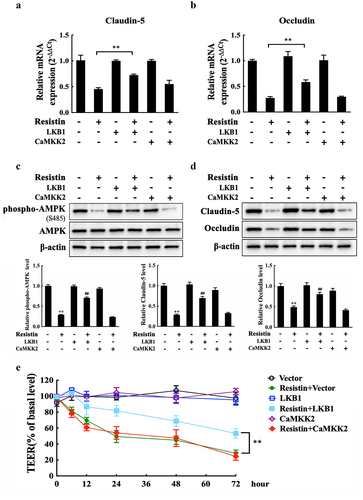
Figure 7. H. parasuis LppA induces resistin expression in vitro and in vivo. (a) PAMs were infected by wild-type SH0165, δlppa mutants, δlolb mutants, δmetq mutants, or δplpa mutants (100 MOI) for 2 h, and resistin expression in PAMs was determined using qRT-PCR. The mRNA levels of each gene were standardized to GAPDH. **p<0.01 compared with the wild-type SH0165 group. (b) PCR detection of the lppA gene deletion mutant and the complementation strain. Bacteria cells were collected to obtain total RNA, which was subsequently reverse-transcribed into cDNA. Primers P9 and P10 were used to detect lppA gene expression using PCR. WT: wild-type H. parasuis, NC: negative control, M: DL2000 marker. (c) the growth status of the wild-type SH0165, ΔlppA mutant, and C-lppA strains. Bacteria cells were cultured for 4 h, and OD600 values were measured every 3 h for each strain. (d, e) PAECs were co-cultured with wild-type PAMs, and PAMs were infected by wild-type SH0165, δlppa mutant, or C-lppA strains (100 MOI) for 2 h. The supernatant and lyses of these PAMs were then collected. The resistin expression in PAMs was analysed using qRT-PCR (d). The mRNA levels of each gene were standardized to GAPDH. The supernatant of PAMs was collected for ELISA analysis (e). (f, g) Resistin levels in serum (e) and primary porcine alveolar macrophages (g) were analysed using ELISA and qRT-PCR, respectively. (h) Adhesion to PAMs by wild-type SH0165, δlppa mutant, or C-lppA strains (100 MOI). **p<0.01. Error bars represent the mean ± SEM (n = 3).
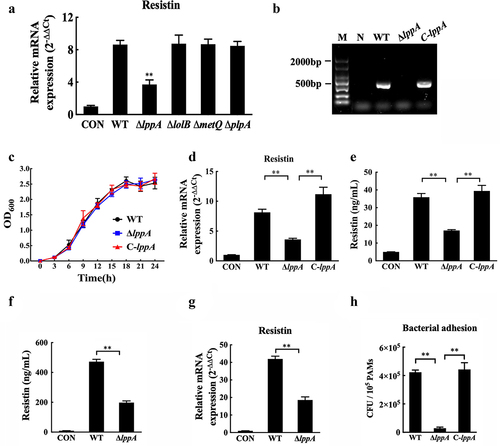
Figure 8. H. parasuis LppA reduces porcine endothelial cell integrity. (a, b) PAECs were co-cultured with wild-type PAMs, and PAMs were infected by wild-type SH0165, δlppa mutant, or C-lppA strains (100 MOI) for 2 h. Protein expression levels of phospho-LKB1 (T189), LKB1, phospho-AMPK (S458), AMPK, phospho-mTOR (S2448), and mTOR in PAECs (a), as well as the claudin-5 and occludin (b), were determined using western blot analysis. The antibodies were diluted as described above. β-actin served as a loading control, and the relative protein level was calculated with ImageJ software and normalized to β-actin. **p<0.01 compared with the untreated group, ##p<0.01 compared with the wild type H. parasuis-infected group. (c) TEER of PAECs was measured at 0, 6, 12, 24, 48, and 2 h after infecting PAMs by wild-type SH0165, δlppa mutant, or C-lppA strains (100 MOI). TEER levels were displayed as a percentage of the TEER before treatment. **p<0.01 compared with the wild-type SH0165 group. (d) claudin-5 and occludin expression in primary PAECs was analysed using qRT-PCR. **p<0.01 compared with the wild-type SH0165 group. Error bars represent the mean ± SEM (n = 3).
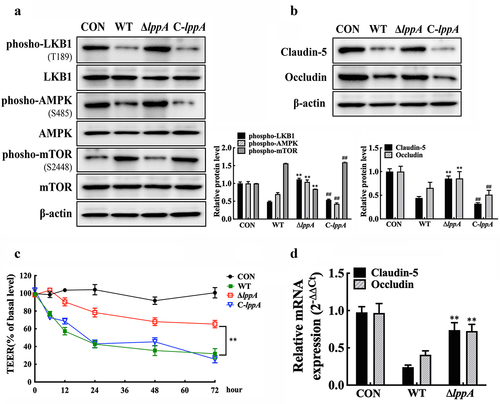
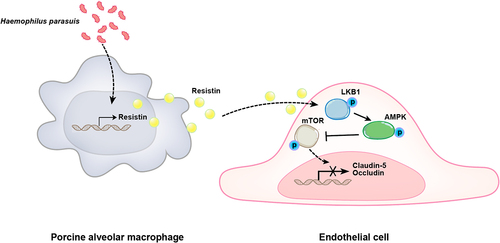
Figure 9. Schematic diagram of the potential cell signalling mechanisms responsible for resistin-induced endothelial cell dysfunction during H. parasuis infection. H. parasuis stimulated PAMs to secret resistin, which inhibited claudin-5 and occludin expression in PAECs through the LKB1/AMPK/mTOR pathway, thereby damaging the endothelial cell monolayer integrity.