
Figures & data
Figure 1. T-antigen specificity of Fab and animal sera. (a) Reactivity of the eighteen Fab and murine and rabbit sera to the T-antigen panel. Sera was diluted at 1: 200 and Fab were diluted to 100 nM, screened by ELISA and absorbances (450 nm) are shown in a colour gradient from white to green. Avidity of the Fab for T18.1 was estimated as the concentration for half-maximum binding (EC50) by ELISA, calculated using an asymmetric sigmoidal, five-parameter logistic equation and shown as an additional column to the right of the heatmap. (b) Comparison of IgG1 and Fab binding to T18.1 by ELISA. The solid lines represent the IgG1 clones while the dotted lines represent the Fab. Estimated avidity of the IgG1 and Fab to T18.1 are indicated. (c) Specificity of IgG1 (solid bars) and Fab (open bars) to the T-antigen panel as measured by ELISA. Dotted line indicates the cut-off (mean+3SD of negative control). Bars represents the mean and standard deviation.
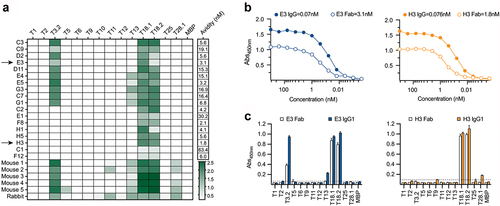
Figure 2. Binding of the IgG1 to T18.1 in the pilus structure. (a). Flow cytometric binding of anti-T18.1 chimeric IgG1 clones and a negative non-binding antibody control (Control) to L. lactis PilM18 at 4°C or 37°C shown as a histogram. MFI for each condition is indicated above the peaks. Anti-human IgG Alexa Fluor 488 was used to detect binding and histograms were generated using FlowJo software. Data shown is representative of two independent experiments. (b) Bactericidal activity of vaccinated animal sera (rabbit anti-T18.1 and mouse anti-pilM18) and chimeric IgG1 clones against GAS (M217/T18.1) compared to control naïve rabbit serum. Data combines three independent experiments and is shown as mean ± SEM. For statistical analysis CFU data were log transformed and analysed by one-way ANOVA with Holm-šídák’s multiple comparisons test.
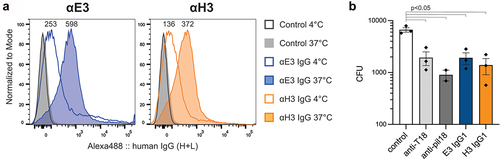
Figure 3. The structure of the E3-T18.1 complex. (a) The E3 Fab heavy chain (light blue) forms the majority of the binding interface with only one loop of the light chain (dark blue) making contact with the T18.1 N-terminal domain (green). The pilin lysine (residue Lys 146) that would be covalently linked to the sortase motif at the C-terminus of the next pilin is shown. (b) The E3 epitope mapped onto the surface of T18.1. (i) The T18.1 residues that make up the E3 epitope are shown in light blue (E3 heavy chain contacts) and dark blue (E3 light chain contacts). The pilin lysine is shown in red. (ii) A “top down” view of the epitope highlights that E3 binds across the top of the pilin N-domain and almost entirely via the Fab heavy chain. (N = N-terminus of T.18.1, C = C-terminus, K = pilin lysine).
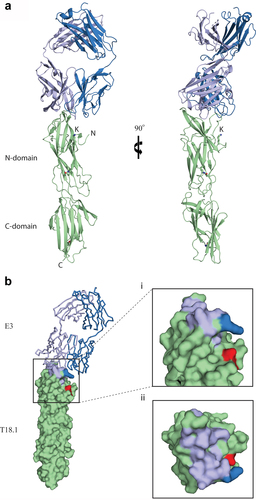
Figure 4. Epitope characterization of the Fab. (a) Capture ELISA in which recombinant T18.1 was captured by chimeric IgG1 coated wells. Fab binding to captured T18.1 was detected using anti-HA-HRP. Binding is compared with a positive (no capture) T18.1 control, and the dotted line represents the negative control cut-off (no fab, mean+3SD). (b) Competition ELISA for the Fab and the epitope spanning peptides. Fab were pre-incubated with each peptide and percentage binding to T18.1 was calculated by comparison with a non-peptide control. (c) Competition ELISA for the Fab with sera from the vaccinated animals. Fab were added together with each antisera and percentage binding was calculated by comparison with a control (1% BSA). Bars represent mean plus SD.

Figure 5. Structural analysis of the T-antigen interface within the polymerized pilus. (a) Ribbon diagram of the T18.1 dimer show that pilins stack end-on-end. The electron density of the sortase motif (S) connecting the two pilins is only partially interpretable. (b) Top view of the T18.1 dimer showing a 120° rotation between each pilin along the long axis, which is identical to that measured in T1 antigen crystal packing [Citation21]. (c) The interface between the two T18.1 pilin monomers (green) is virtually identical to the T1 crystal packing interface (magenta), as is the distance between the pilin lysine (k) and the C-terminus of the next pilin (dashed line). (d) The small interface supports a model in which T-antigen inter-pilin contacts are relatively weak, potentially functioning like a knee joint whereby the pilin flexes in only one direction as the covalent isopeptide bond prevents bending in the opposite direction, or complete disassociation. The 120° rotation between each successive pilin allows 360° flexibility along the length of the pilus. (T18.1 = green, T1 = magenta, K = pilin lysine, S = sortase motif).
![Figure 5. Structural analysis of the T-antigen interface within the polymerized pilus. (a) Ribbon diagram of the T18.1 dimer show that pilins stack end-on-end. The electron density of the sortase motif (S) connecting the two pilins is only partially interpretable. (b) Top view of the T18.1 dimer showing a 120° rotation between each pilin along the long axis, which is identical to that measured in T1 antigen crystal packing [Citation21]. (c) The interface between the two T18.1 pilin monomers (green) is virtually identical to the T1 crystal packing interface (magenta), as is the distance between the pilin lysine (k) and the C-terminus of the next pilin (dashed line). (d) The small interface supports a model in which T-antigen inter-pilin contacts are relatively weak, potentially functioning like a knee joint whereby the pilin flexes in only one direction as the covalent isopeptide bond prevents bending in the opposite direction, or complete disassociation. The 120° rotation between each successive pilin allows 360° flexibility along the length of the pilus. (T18.1 = green, T1 = magenta, K = pilin lysine, S = sortase motif).](/cms/asset/2bbeead4-44ce-4b2a-8f11-72b472dc1654/kvir_a_2180228_f0005_oc.jpg)
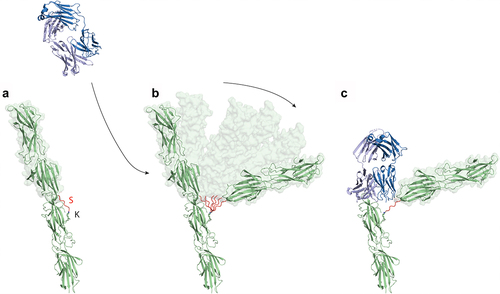
Figure 6. The binding of the E3 Fab to the polymerized T18.1 pilus indicates significant flexibility between T-antigen monomers. (a) Ribbon diagram showing T18.1 dimer structure depicting the polymerization of T18.1 subunits in the pilus. The inter-domain sortase linker (S) is highlighted in Red. The final threonine in this linker (TQVPT) is covalently linked to the pilin lysine (K) in the N-domain of the proceeding pilin via a Sortase C catalysed isopeptide bond. (b) The small interface between pilins suggest they may temporarily disassociate, bend away from the vertical axis, which allows E3 to bind. (c) The top T18.1 subunit would be displaced by the E3 Fab, but is still covalently linked to the next pilin in the pilus.
Supplemental Material
Download MS Word (546 KB)Data availability statement
Atom coordinates and structure factors have been deposited in the Worldwide Protein Data Bank (wwPDB) with PDB accession numbers 8F5N for E3-T18.1 and 8F70 for T18.1 dimer. The authors confirm that the remaining data supporting the findings of this study are available within the article. Additional data are available from the corresponding author [NJM] upon reasonable request.