
Figures & data
Figure 1. MoxR1 induced the expression of TLR4 along with its organization in the plasma membrane. (a) the modelled and simulated structure of MoxR1 shows its conserved domains and motifs. (b) Front view (c) Top View of (TLR4)2-(MoxR1)2 obtained through Clus-Pro protein docking. (d) Immunofluorescence images of TLR4 organization in the membrane. Increasing concentrations of MoxR1 were treated to RAW264.7 cells, and after 4 hrs of treatment, cells were used in immunofluorescence labelling. (e) FACS analysis showed enhanced expression of TLR4 in MoxR1-stimulated RAW264.7 cells. (f) Bar graph shows the quantitative representation of TLR4 expression in RAW264.7 cells. (g) Co-localization of MoxR1 and TLR4 in RAW264.7 cells stimulated with MoxR1. Two-way ANOVA was used for data analysis. Data are presented as means ±SD in comparison to the control. P value less than × 0.05, **0.01, ***0.001. All the graphs were prepared in GraphPad 9.0.
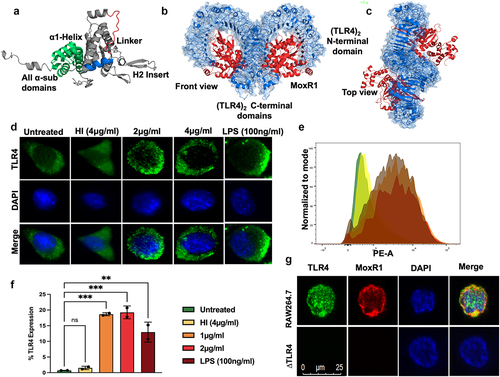
Figure 2. MoxR1 induced the enhanced secretion of inflammatory cytokines. Level of (a) TNF (b) IL6 (c) IL12 produced when RAW264.7 cells were stimulated with the increasing amount of MoxR1. Levels of (d) TNF, (e) IL6, and (f) IL12 were produced when TLR knockout cell lines were treated with MoxR1. Sandwich ELISA was used for measuring cytokines. LPS stimulation was used as positive control. The mean from three independent experiments was used to calculate the standard deviation. Data are presented as means ±SD in comparison to the control. P value less than × 0.05, **0.01, ***0.001. All the graphs were prepared in GraphPad 9.0.
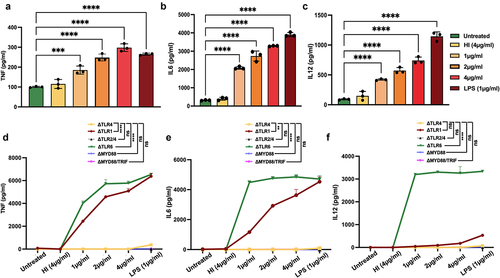
Figure 3. Proinflammatory cytokine secretion by MoxR1 depends on the activation of NFKB and MAPK signalling pathways. (a) Western blot analysis of enhanced NFKB (P50) expression with increasing concentration of MoxR1 treated RAW264.7 cells. (b) Level of NFKB1 was quantitated and normalized to GAPDH [%]. (c) Western blot depicting the phosphorylated pP65 subunit of NFKB signalling pathway after MoxR1 treatment to RAW264.7 cells for 24 hr. (d) RelA (pP65) level was measured and normalized to GAPDH [%]. (e) Immunofluorescence images show enhanced localization of NFKB (P50) subunit in the nucleus with increasing concentration of MoxR1 treatment to murine macrophage cells (RAW264.7) (f) Immunofluorescence images showing nuclear localization of RelA (pP65) subunit with increasing concentration of MoxR1 treatment to macrophage cells (RAW264.7). The scale bar represents 10 µm. (g) Western blot analysis of pERK, tERK, pP38, tP38 in MoxR1 treated RAW264.7 cell line. (h) pERK1/2 was quantitated and normalized to tERK1/2 [%]. (I) pP38 was measured and normalized to tP38 [%]. The mean from two or three independent experiments was used to calculate the standard deviation. Data are presented as means ±SD in comparison to the control. P value less than × 0.05, **0.01, ***0.001. All the graphs were prepared in GraphPad 9.0.
![Figure 3. Proinflammatory cytokine secretion by MoxR1 depends on the activation of NFKB and MAPK signalling pathways. (a) Western blot analysis of enhanced NFKB (P50) expression with increasing concentration of MoxR1 treated RAW264.7 cells. (b) Level of NFKB1 was quantitated and normalized to GAPDH [%]. (c) Western blot depicting the phosphorylated pP65 subunit of NFKB signalling pathway after MoxR1 treatment to RAW264.7 cells for 24 hr. (d) RelA (pP65) level was measured and normalized to GAPDH [%]. (e) Immunofluorescence images show enhanced localization of NFKB (P50) subunit in the nucleus with increasing concentration of MoxR1 treatment to murine macrophage cells (RAW264.7) (f) Immunofluorescence images showing nuclear localization of RelA (pP65) subunit with increasing concentration of MoxR1 treatment to macrophage cells (RAW264.7). The scale bar represents 10 µm. (g) Western blot analysis of pERK, tERK, pP38, tP38 in MoxR1 treated RAW264.7 cell line. (h) pERK1/2 was quantitated and normalized to tERK1/2 [%]. (I) pP38 was measured and normalized to tP38 [%]. The mean from two or three independent experiments was used to calculate the standard deviation. Data are presented as means ±SD in comparison to the control. P value less than × 0.05, **0.01, ***0.001. All the graphs were prepared in GraphPad 9.0.](/cms/asset/ef5550bc-e39a-4585-b94d-a64f22a2e787/kvir_a_2180230_f0003_oc.jpg)
Figure 4. Inhibition of autophagy by MoxR1 is dependent on TLR4. (a) Pictorial representation of domains of MoxR1 and positions of putative LC3-interacting region (LIR) motifs shown with an arrowhead. (b) Western blot analysis representing the expression of autophagy markers LC3II, P62, beclin1, and Rab7 in MoxR1 treated RAW264.7 cells. (c) LC3BII (d) p62/SQSTM1 (e) beclin 1 (f) P62/beclin1 ratio (g) Rab7 was measured and normalized to GAPDH [%]. (h) Western blot analysis representing the expression of autophagy markers LC3BII, P62, and beclin1 in MoxR1 treated ΔTLR4 cells. (i) LC3BII (j) p62/SQSTM1 (k) beclin 1 (l) P62/beclin1 ratio was quantitated and normalized to GAPDH [%] in MoxR1 treated ΔTLR4 cells. The mean from two or three independent experiments was used to calculate the standard deviation. Data are presented as means ±SD in comparison to the control. P value less than × 0.05, **0.01, ***0.001. All the graphs were prepared in GraphPad 9.0.
![Figure 4. Inhibition of autophagy by MoxR1 is dependent on TLR4. (a) Pictorial representation of domains of MoxR1 and positions of putative LC3-interacting region (LIR) motifs shown with an arrowhead. (b) Western blot analysis representing the expression of autophagy markers LC3II, P62, beclin1, and Rab7 in MoxR1 treated RAW264.7 cells. (c) LC3BII (d) p62/SQSTM1 (e) beclin 1 (f) P62/beclin1 ratio (g) Rab7 was measured and normalized to GAPDH [%]. (h) Western blot analysis representing the expression of autophagy markers LC3BII, P62, and beclin1 in MoxR1 treated ΔTLR4 cells. (i) LC3BII (j) p62/SQSTM1 (k) beclin 1 (l) P62/beclin1 ratio was quantitated and normalized to GAPDH [%] in MoxR1 treated ΔTLR4 cells. The mean from two or three independent experiments was used to calculate the standard deviation. Data are presented as means ±SD in comparison to the control. P value less than × 0.05, **0.01, ***0.001. All the graphs were prepared in GraphPad 9.0.](/cms/asset/9f4dfa0c-6f47-4e62-9ddc-c269fb604914/kvir_a_2180230_f0004_oc.jpg)
Figure 5. MoxR1 downregulated the autophagy flux by inhibiting the autophagy initiation. (a) Western blot was used to analyse the expression of autophagy markers such as LC3BII and SQSTM1 in macrophages treated with MoxR1 and rapamycin (200 nm) or bafilomycin A1 (50 nm). (b) LC3BII was measured and normalized to GAPDH [%]. (c) p62/SQSTM1 was quantitated and normalized to GAPDH [%]. (d) Immunofluorescence images showing the LC3BII puncta foci produced in MoxR1 and/or rapamycin-treated RAW264.7 cells. (e) Immunofluorescence images showing the LC3BII puncta foci produced in MoxR1 and/or bafilomycin A1 stimulated RAW264.7 cells. The nucleus was stained using DAPI. (f and g) the bar graph represents the average number of LC3BII puncta foci generated when RAW264.7 was treated with MoxR1, rapamycin, and bafilomycinA1. (H) Growth curve analysis of M. smegmatis vector alone, and M. smegmatis expressing MoxR1 (i) Intracellular survival of vector alone, and M. smegmatis expressing MoxR1 after the infection (MOI 1:10) in RAW264.7 cells. After infection, cells were lysed in 0.01% SDS containing 1×PBS, and dilutions were plated onto a 7H11 agar plate supplemented with OADC. On the fourth day, colonies on agar plates were counted (j). Growth of M. smegmatis vector alone and MoxR1 expressing M. smegmatis was analysed in the presence of bafilomycin A1 and rapamycin. Post-infection (MOI 1:10), RAW264.7 cells were stimulated with either rapamycin (200 nm) or bafilomycin (50 nm). Cells were lysed, and CFU was determined on the fourth day of plating. The mean from two or three independent experiments was used to calculate the standard deviation. Data are presented as means ±SD in comparison to the control. P value less than × 0.05, **0.01, ***0.001. All the graphs were prepared in GraphPad 9.0.
![Figure 5. MoxR1 downregulated the autophagy flux by inhibiting the autophagy initiation. (a) Western blot was used to analyse the expression of autophagy markers such as LC3BII and SQSTM1 in macrophages treated with MoxR1 and rapamycin (200 nm) or bafilomycin A1 (50 nm). (b) LC3BII was measured and normalized to GAPDH [%]. (c) p62/SQSTM1 was quantitated and normalized to GAPDH [%]. (d) Immunofluorescence images showing the LC3BII puncta foci produced in MoxR1 and/or rapamycin-treated RAW264.7 cells. (e) Immunofluorescence images showing the LC3BII puncta foci produced in MoxR1 and/or bafilomycin A1 stimulated RAW264.7 cells. The nucleus was stained using DAPI. (f and g) the bar graph represents the average number of LC3BII puncta foci generated when RAW264.7 was treated with MoxR1, rapamycin, and bafilomycinA1. (H) Growth curve analysis of M. smegmatis vector alone, and M. smegmatis expressing MoxR1 (i) Intracellular survival of vector alone, and M. smegmatis expressing MoxR1 after the infection (MOI 1:10) in RAW264.7 cells. After infection, cells were lysed in 0.01% SDS containing 1×PBS, and dilutions were plated onto a 7H11 agar plate supplemented with OADC. On the fourth day, colonies on agar plates were counted (j). Growth of M. smegmatis vector alone and MoxR1 expressing M. smegmatis was analysed in the presence of bafilomycin A1 and rapamycin. Post-infection (MOI 1:10), RAW264.7 cells were stimulated with either rapamycin (200 nm) or bafilomycin (50 nm). Cells were lysed, and CFU was determined on the fourth day of plating. The mean from two or three independent experiments was used to calculate the standard deviation. Data are presented as means ±SD in comparison to the control. P value less than × 0.05, **0.01, ***0.001. All the graphs were prepared in GraphPad 9.0.](/cms/asset/bfc91584-1359-40fe-a0ff-a2edbac9bc33/kvir_a_2180230_f0005_oc.jpg)
Figure 6. Inhibition of autophagy by MoxR1 is mediated through activation of the PI3K-AKT-MTOR-ULK1 signalling axis. (a) Western blot analysis shows activated phospho pPI3K, pAKT, pMTOR, and pULK1 kinases in MoxR1 (2 and 4 µg/ml) treated RAW264.7 cells. The MoxR1 concentrations used in treating macrophages and the molecular weight of the activated/inhibited phospho enzymes in response to MoxR1 and phospho antibodies are marked in the figure. (b, c, d, and e) p-PI3k, p-AKT, p-ULK1, and pMTOR protein levels were quantified and normalized to GAPDH or β-actin [%]. (f) Western blot analysis showing the expression of p-AKT in MoxR1 treated to ΔTLR4 cells. (g) the p-AKT level was measured and normalized to GAPDH [%]. The mean from two or three independent experiments was used to calculate the standard deviation. Data are presented as means ±SD in comparison to the control. P value less than × 0.05, **0.01, ***0.001. All the graphs were prepared in GraphPad 9.0.
![Figure 6. Inhibition of autophagy by MoxR1 is mediated through activation of the PI3K-AKT-MTOR-ULK1 signalling axis. (a) Western blot analysis shows activated phospho pPI3K, pAKT, pMTOR, and pULK1 kinases in MoxR1 (2 and 4 µg/ml) treated RAW264.7 cells. The MoxR1 concentrations used in treating macrophages and the molecular weight of the activated/inhibited phospho enzymes in response to MoxR1 and phospho antibodies are marked in the figure. (b, c, d, and e) p-PI3k, p-AKT, p-ULK1, and pMTOR protein levels were quantified and normalized to GAPDH or β-actin [%]. (f) Western blot analysis showing the expression of p-AKT in MoxR1 treated to ΔTLR4 cells. (g) the p-AKT level was measured and normalized to GAPDH [%]. The mean from two or three independent experiments was used to calculate the standard deviation. Data are presented as means ±SD in comparison to the control. P value less than × 0.05, **0.01, ***0.001. All the graphs were prepared in GraphPad 9.0.](/cms/asset/8f36d285-679e-401c-bdbd-845ed63b2cdb/kvir_a_2180230_f0006_oc.jpg)
Figure 7. MoxR1 inhibited apoptosis by inhibiting the transcription factors pc-FOS and p-JNK1/2 in RAW264.7 cells. (a) FACS analysis of the different stages that is, early and late apoptosis in MoxR1 treated murine macrophages. Untreated, Heat inactivated, and ZVAD-FMK was used as the negative control, whereas Staurosporine stimulation was used as the positive control. (b) The bar graph shows the early apoptotic cells in different samples, as marked in the figure. (c) Western blot analysis shows the expression of pc-FOS, tc-FOS, pJNK1/2, tJNK1/2, and β-actin. (d and e) Bar graph showing the protein level of phosphoproteins normalized to the total proteins [%]. (f) CFU/ml was used to analyze the intracellular survival of M. smegmatis (vector alone and recombinant) infected with macrophage cells. Post-infection cells were treated with tunicamycin for 4 hrs, and after 24hrs, cells were lysed and plated onto a 7H11 agar plate supplemented with OADC. The mean from two or three independent experiments was used to calculate the standard deviation. Data are presented as means ±SD in comparison to the control. P value less than *0.05, **0.01, ***0.001. All the graphs were prepared in GraphPad 9.0.
![Figure 7. MoxR1 inhibited apoptosis by inhibiting the transcription factors pc-FOS and p-JNK1/2 in RAW264.7 cells. (a) FACS analysis of the different stages that is, early and late apoptosis in MoxR1 treated murine macrophages. Untreated, Heat inactivated, and ZVAD-FMK was used as the negative control, whereas Staurosporine stimulation was used as the positive control. (b) The bar graph shows the early apoptotic cells in different samples, as marked in the figure. (c) Western blot analysis shows the expression of pc-FOS, tc-FOS, pJNK1/2, tJNK1/2, and β-actin. (d and e) Bar graph showing the protein level of phosphoproteins normalized to the total proteins [%]. (f) CFU/ml was used to analyze the intracellular survival of M. smegmatis (vector alone and recombinant) infected with macrophage cells. Post-infection cells were treated with tunicamycin for 4 hrs, and after 24hrs, cells were lysed and plated onto a 7H11 agar plate supplemented with OADC. The mean from two or three independent experiments was used to calculate the standard deviation. Data are presented as means ±SD in comparison to the control. P value less than *0.05, **0.01, ***0.001. All the graphs were prepared in GraphPad 9.0.](/cms/asset/bbc40b08-c7c2-4087-94cd-14eadc753f83/kvir_a_2180230_f0007_oc.jpg)
Figure 8. MoxR1 induced robust metabolic repurposing by inhibiting the mitochondrial bioenergetics. (a) the expression of the citric acid cycle and electron transport chain proteins, including succinate Dehydrogenase (SDHA), pyruvate dehydrogenase (PD), and HSP60, was analysed using western blot analysis. (b, c, and d) Bar graph showing the protein quantitation normalized with β-actin. (e) Western blot shows the expression of enzymes CoxIV and CytC in the MoxR1 treated RAW264.7 cells after 24 hrs of treatment. (f and g) Bar graph showing the quantitative analysis of proteins CoxIV and CytC normalized to β-actin [%]. The mean from two or three independent experiments was used to calculate the standard deviation. Data are presented as means ±SD in comparison to the control. P value less than × 0.05, **0.01, ***0.001. All the graphs were prepared in GraphPad 9.0.
![Figure 8. MoxR1 induced robust metabolic repurposing by inhibiting the mitochondrial bioenergetics. (a) the expression of the citric acid cycle and electron transport chain proteins, including succinate Dehydrogenase (SDHA), pyruvate dehydrogenase (PD), and HSP60, was analysed using western blot analysis. (b, c, and d) Bar graph showing the protein quantitation normalized with β-actin. (e) Western blot shows the expression of enzymes CoxIV and CytC in the MoxR1 treated RAW264.7 cells after 24 hrs of treatment. (f and g) Bar graph showing the quantitative analysis of proteins CoxIV and CytC normalized to β-actin [%]. The mean from two or three independent experiments was used to calculate the standard deviation. Data are presented as means ±SD in comparison to the control. P value less than × 0.05, **0.01, ***0.001. All the graphs were prepared in GraphPad 9.0.](/cms/asset/0cd0ea83-cfbc-4043-9e35-c9c6d3218868/kvir_a_2180230_f0008_oc.jpg)
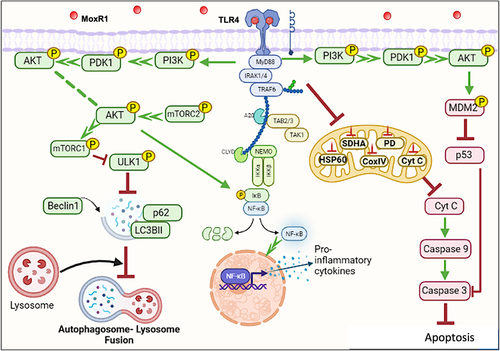
Figure 9. MoxR1 is a potent TLR4 agonist that activates downstream NFKB and MAPK signalling cascades to suppress autophagy and apoptosis. MoxR1 interacted with TLR4 to activate the downstream signalling cascades (NFKB and MAPK) by recruiting MYD88. The enhanced production of proinflammatory cytokines by Moxr1 depended on the activation of NFKB and MAPK signalling pathways. It inhibited autophagy, as evidenced by the protein levels of the classical autophagy markers. MoxR1 activated the pro-survival signalling cascade PI3k-AKT-MTOR to inhibit autophagy initiation. Moreover, MoxR1 also repressed MAPK JNK1/2 and cFOS to inhibit apoptosis, a crucial innate defence mechanism used to control the replication of pathogens. Notably, MoxR1 also induced robust metabolic reprogramming for rewiring the citric acid cycle intermediates for its benefit. Intracellular pathogens, including L. pneumophila and M. tb, inhibit mitochondrial oxidative phosphorylation for activating glycolysis-mediated production of ATP so that pathogen can exploit citric acid cycle intermediates for its metabolism. Our findings suggest that MoxR1 is a moonlighting protein of M. tb that the pathogen exploits to dampen host-directed defences for successful survival and virulence.
Supplemental Material
Download Zip (2.3 MB)Data availability statement
Data available within the article or its supplementary materials