
Figures & data
Table 1. Characteristics of chronic HBV-infected pregnant patients.
Table 2. ALT and HBV DNA levels of acute flare of CHB patients.
Table 3. Dynamic changes in ALT and AST at different test points.
Figure 1. Characteristics of newborn infants of chronic HBV-infected mothers.
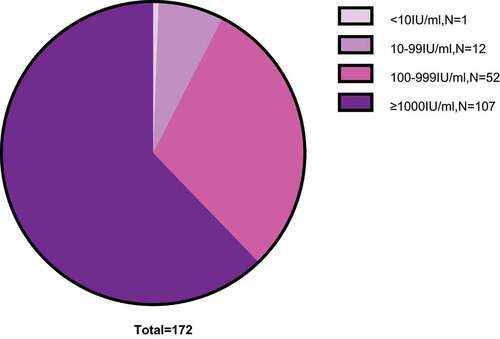
Figure 2. Dynamic changes in HBcrAg at different test points.
Figure 3. HBcrAg levels of acute flare of CHB patients and no acute flare of CHB patients at postpartum week 12.
Figure 4. ROC curve analysis of serum HBcrAg in identifying patients with acute flares of CHB.
Table 4. Negative predictive value of serum HBcrAg in predicting acute flares of CHB.
Table 5. HBcrAg and HBsAg are associated with acute flare of CHB.
Supplemental Material
Download MS Word (14.6 KB)Data availability statement
The datasets used and/or analysed during the current study are available from the corresponding author upon reasonable request. If you need supporting data, you can contact us at any time. Email: [email protected].