1,507
Views
2
CrossRef citations to date
0
Altmetric
Research Paper

Mitochondrial N-formyl methionine peptides contribute to exaggerated neutrophil activation in patients with COVID-19

, , , , , , , , , , , & ORCID Icon show all
Article: 2218077 | Received 24 Mar 2023, Accepted 20 May 2023, Published online: 29 May 2023

Figures & data

Table 1. Patient characteristics.

Figure 1. Elevated concentrations of neutrophil activation markers in plasma of COVID-19 patients. Concentrations of neutrophil activation markers (a) calprotectin and (b and c) neutrophil extracellular traps (NETs; measured as neutrophil elastase-DNA complexes, NE-DNA and myeloperoxidase-DNA complexes, MPO-DNA respectively) were measured in stored plasma samples at baseline in COVID-19 patients with disease severity ranging from mild to moderate (mod) to critically ill patients. Comparison of critically ill patients with or without COVID-19 was also performed. (d-f) ICU patients were stratified based on ARDS and assessed for neutrophil activation markers. All assays were analysed by ELISA in plasma samples from COVID-19 patients and healthy controls (HC). Data are represented as dot plot graphs and bars represent the median. Each symbol represents a single subject. Statistics were performed by Mann-Whitney U test.
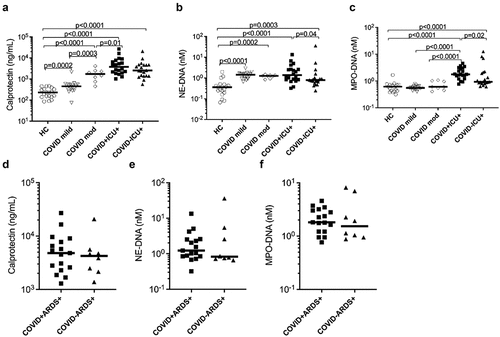
Figure 1. Elevated concentrations of neutrophil activation markers in plasma of COVID-19 patients. Concentrations of neutrophil activation markers (a) calprotectin and (b and c) neutrophil extracellular traps (NETs; measured as neutrophil elastase-DNA complexes, NE-DNA and myeloperoxidase-DNA complexes, MPO-DNA respectively) were measured in stored plasma samples at baseline in COVID-19 patients with disease severity ranging from mild to moderate (mod) to critically ill patients. Comparison of critically ill patients with or without COVID-19 was also performed. (d-f) ICU patients were stratified based on ARDS and assessed for neutrophil activation markers. All assays were analysed by ELISA in plasma samples from COVID-19 patients and healthy controls (HC). Data are represented as dot plot graphs and bars represent the median. Each symbol represents a single subject. Statistics were performed by Mann-Whitney U test.

Figure 2. Plasma concentrations of the neutrophil activation marker calprotectin were associated with clinical parameters in COVID-19 patients. Association of plasma calprotectin levels in the presence and absence of (a) chills, (b) cough, (c) hard breathing (hard breath) and (d) oxygen treatment (oxygen treat) in COVID-19 patients. (e) Correlation analysis between calprotectin levels and respiration rate per minute in COVID-19 patients. Clinically well-characterized COVID-19 patients with mild and moderate/severe disease manifestations were used for this analysis. (a-d) Data are represented as dot plot graphs and bars represent the median. Each symbol represents a single subject. Statistics were performed by (a-d) Mann-Whitney U test and (e) Spearman’s correlation test.
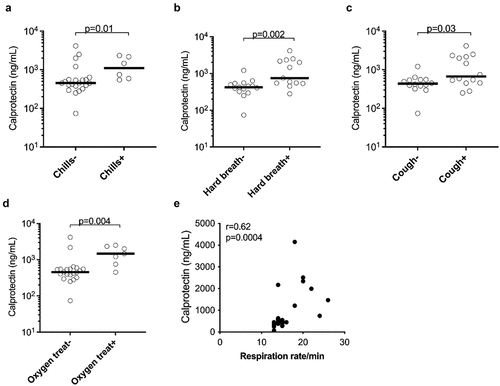
Figure 2. Plasma concentrations of the neutrophil activation marker calprotectin were associated with clinical parameters in COVID-19 patients. Association of plasma calprotectin levels in the presence and absence of (a) chills, (b) cough, (c) hard breathing (hard breath) and (d) oxygen treatment (oxygen treat) in COVID-19 patients. (e) Correlation analysis between calprotectin levels and respiration rate per minute in COVID-19 patients. Clinically well-characterized COVID-19 patients with mild and moderate/severe disease manifestations were used for this analysis. (a-d) Data are represented as dot plot graphs and bars represent the median. Each symbol represents a single subject. Statistics were performed by (a-d) Mann-Whitney U test and (e) Spearman’s correlation test.

Figure 3. Plasma concentrations of mitochondrial-derived N-formyl methionine peptides (fMet) were elevated in patients with COVID-19 and associated with clinical parameters of the disease. (a) Levels of fMet were measured in plasma samples from mild to critically ill COVID-19 patients and healthy controls (HC) by ELISA. Additionally, fMet levels were analysed in critically ill patients with or without COVID-19. (b and c) Association of plasma fMet levels in the presence and absence of (b) chills and (c) diarrhoea in COVID-19 patients. Clinically well-characterized COVID-19 patients with mild and moderate/severe disease manifestations were used for associations between plasma fMet levels and clinical variables of disease. Data are represented as dot plot graphs and bars represent the median. Each symbol represents a single subject. Statistics were performed by the Mann-Whitney U test.
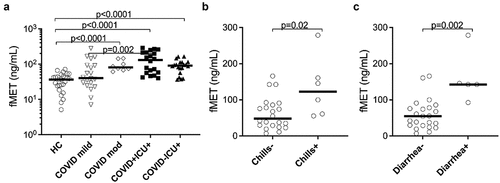
Figure 3. Plasma concentrations of mitochondrial-derived N-formyl methionine peptides (fMet) were elevated in patients with COVID-19 and associated with clinical parameters of the disease. (a) Levels of fMet were measured in plasma samples from mild to critically ill COVID-19 patients and healthy controls (HC) by ELISA. Additionally, fMet levels were analysed in critically ill patients with or without COVID-19. (b and c) Association of plasma fMet levels in the presence and absence of (b) chills and (c) diarrhoea in COVID-19 patients. Clinically well-characterized COVID-19 patients with mild and moderate/severe disease manifestations were used for associations between plasma fMet levels and clinical variables of disease. Data are represented as dot plot graphs and bars represent the median. Each symbol represents a single subject. Statistics were performed by the Mann-Whitney U test.

Figure 4. Mitochondrial fMet contributes to neutrophil activation by signalling through FPR1 receptors. Neutrophil activation upon incubation for 2 hours with plasma from HC and COVID-19 patient samples with mild and moderate disease manifestation. Neutrophils were pre-incubated in the presence or absence of FPR1 antagonist Cyclosporine H (CsH) and neutrophil activation markers (a) CD11b and (b) CD66b were assessed by flow cytometry. Data is represented as dot plot graphs indicating the MFI of CD11b and CD66b and bars represent the median. Each symbol represents a single subject. Statistics were performed by Mann-Whitney U test and Wilcoxon test. NS: Non-significant.
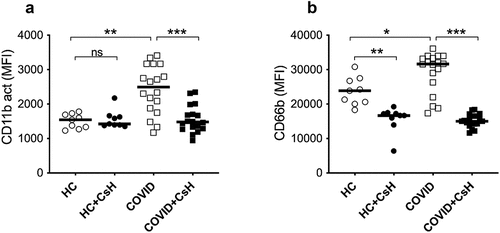
Figure 4. Mitochondrial fMet contributes to neutrophil activation by signalling through FPR1 receptors. Neutrophil activation upon incubation for 2 hours with plasma from HC and COVID-19 patient samples with mild and moderate disease manifestation. Neutrophils were pre-incubated in the presence or absence of FPR1 antagonist Cyclosporine H (CsH) and neutrophil activation markers (a) CD11b and (b) CD66b were assessed by flow cytometry. Data is represented as dot plot graphs indicating the MFI of CD11b and CD66b and bars represent the median. Each symbol represents a single subject. Statistics were performed by Mann-Whitney U test and Wilcoxon test. NS: Non-significant.

Figure 5. Plasma concentrations of fMet are associated with calprotectin in COVID-19 patients. Levels of fMet and calprotectin were assessed by ELISA in patients with various disease subgroups. Correlation analysis between calprotectin and fMet from (a) mild and moderate and (b) critically ill patients with COVID and (c) critically ill patients without COVID are shown. Each symbol represents a single subject. Statistics were determined by Spearman’s correlation test.

Figure 5. Plasma concentrations of fMet are associated with calprotectin in COVID-19 patients. Levels of fMet and calprotectin were assessed by ELISA in patients with various disease subgroups. Correlation analysis between calprotectin and fMet from (a) mild and moderate and (b) critically ill patients with COVID and (c) critically ill patients without COVID are shown. Each symbol represents a single subject. Statistics were determined by Spearman’s correlation test.